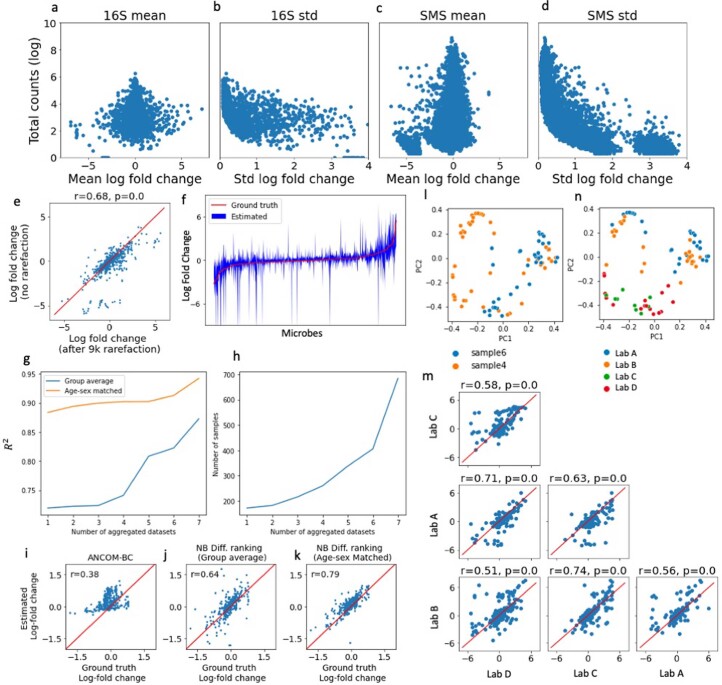
Extended Data Fig. 2. Benchmarks.
(a-d) Mean and standard deviations of the per-microbe log-fold changes compared to the total sequencing depth (log10 scale) for each microbe. e) Rarefaction benchmark, showcasing how differential abundance analysis is insensitive to rarefaction. (f) Differential abundance estimation derived from a data-driven simulated 16S dataset. (g) Comparison of age- and sex-matching approach compared to standard group averaging with respect to dataset size across 7 of the 11 16S studies (excluding Kang et al52, David et al37 and Son et al36 The x-axis represents the number of aggregated datasets, the y-axis on the left panel is the average R2 metric to measure the model error. (h) Number of samples analyzed on the y-axis, and the x-axis on the right panel is the number of aggregated dataset. (i-k) Simulated datasets with a sequencing depth differential between matched cases and controls, where matched controls always have a larger sequencing depth than their case counterparts. This benchmark investigates how well ANCOM-BC, group averaged differential ranking and age-sex matched differential ranking can recover the ground truth log-fold changes. The group averaged and age-sex matched differential ranking both use the Negative Binomial (NB) distribution to model sequencing count data.(l-m) Simulated datasets comparing household matching to age-sex matching. (l-n) Bray-Curtis PCoA of 2 samples replicated across 4 processing labs in the MBQC31. (m) Pairwise comparsions of log-fold change between 2 samples across all 4 labs using group-averaged differential abundance analysis.

