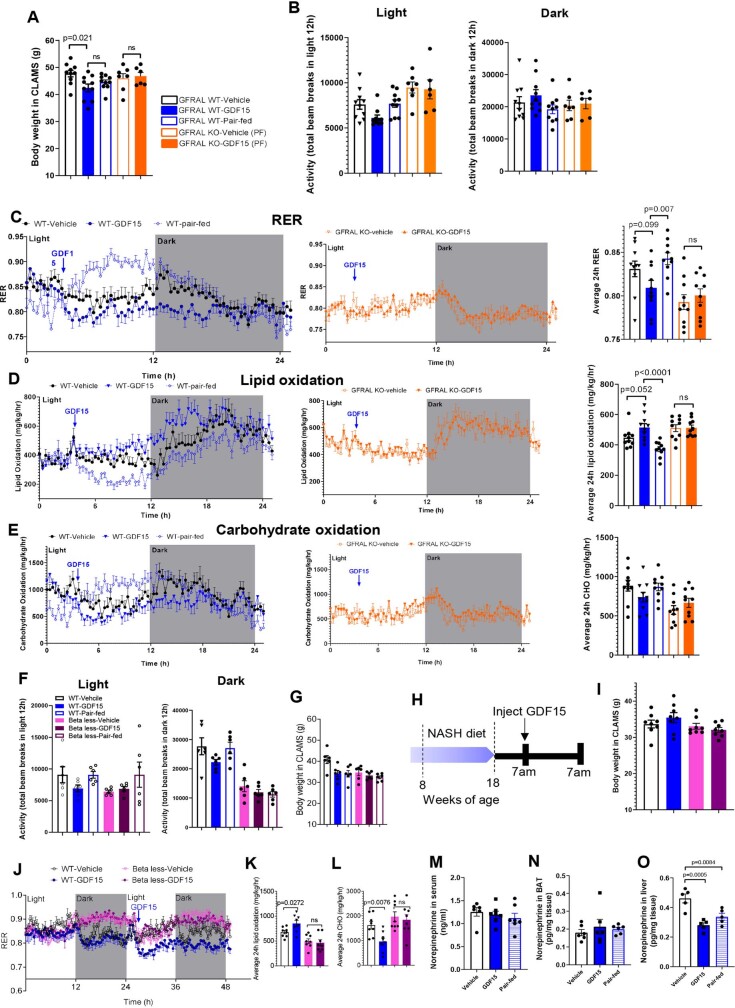
Extended Data Fig. 6. GDF15 increases energy expenditure and fatty acid oxidation through GFRAL and beta-adrenergic signalling.
A, Body weight in Comprehensive Lab Animal Monitor System (CLAMS). Data are means ± SEM, n = 10 mice (WT-vehicle, WT-GDF15 and WT-pair-fed), n = 7 mice (KO-Pair-fed) and n = 6 mice (KO-GDF15). P values by one-way ANOVA with Dunnett’s multiple comparisons test. B, Animal activity during 12h-light/dark circle. Data are means ± SEM, n = 10 mice (WT-vehicle, WT-GDF15 and WT-pair-fed), n = 7 mice (KO-Pair-fed) and n = 6 mice (KO-GDF15). C, Average respiratory exchange ratios (RER) curves in WT and GFRAL KO mice and quantification of average 24h RER. Data are means ± SEM, n = 10 mice/group. P values by one-way ANOVA with Šídák’s multiple comparisons test. D, Average lipid oxidation curves in WT and GFRAL KO mice and quantification of average 24h lipid oxidation. Data are means ± SEM, n = 10 mice/group. P values by one-way ANOVA with Šídák’s multiple comparisons test. E, Average carbohydrate oxidation (CHO) curves in WT and GFRAL KO mice and quantification of average 24h CHO. Data are means ± SEM, n = 10 mice/group. P values by one-way ANOVA with Šídák’s multiple comparisons test. F, Animal activity during 12h-light/dark circle. Data are means ± SEM, n = 6 mice/group. G, Body mass of mice in CLAMS. n = 6 mice/group. H, Experimental scheme for the effects of a single injection of GDF15 on respiratory exchange ratios (RER), lipid oxidation and carbohydrate oxidation (CHO) in WT and beta-less mice. I, Body weight in CLAMS. Data are means ± SEM, n = 8 mice/group. J, Respiratory exchange ratio (RER) over time in WT and beta-less mice. Data are means ± SEM, n = 8 mice/group. K, Average fatty acid oxidation over 24hours. Data are means ± SEM, n = 8 mice/group. P values by one-way ANOVA with Tukey’s multiple comparisons test. L, Average carbohydrate oxidation over 24h. Data are means ± SEM, n = 8 mice/group. P values by one-way ANOVA with Tukey’s multiple comparisons test. M, GDF15 did not change serum norepinephrine. Data are means ± SEM, n = 7 mice/group except vehicle group, n = 6 mice. N, GDF15 did not change norepinephrine in the brown adipose tissue (BAT). Data are means ± SEM, n = 6 mice/group. O, GDF15 did not change norepinephrine in the liver. Data are means ± SEM, n = 5 mice/group. P values by one-way ANOVA with Tukey’s multiple comparisons test.

