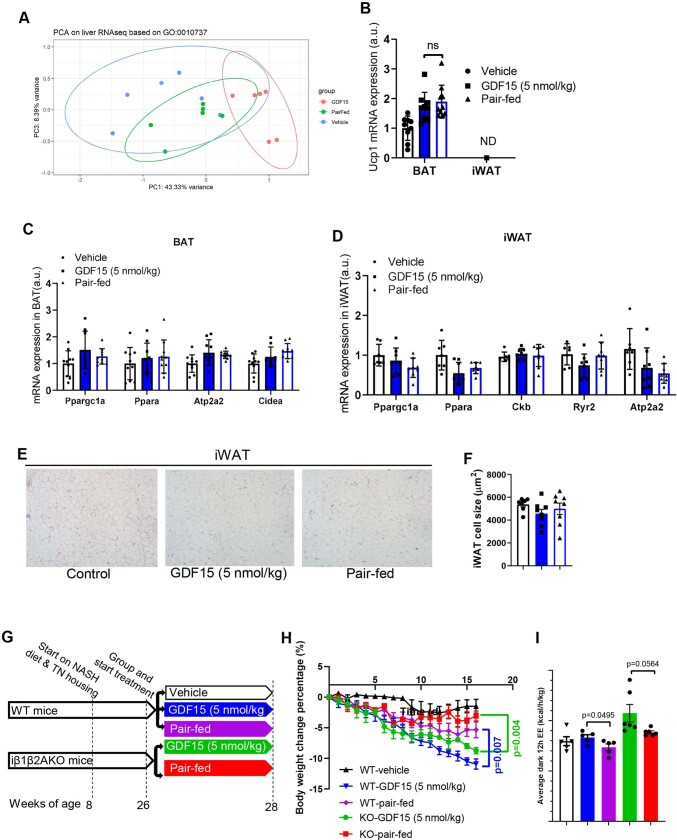
Extended Data Fig. 7. GDF15 does not alter SNS signalling in liver, expression of thermogenic genes in adipose tissue and does not require adipose tissue AMPK to induce weight loss.
A, Principal component analysis (PCA) for liver RNAseq data based on protein kinase A signalling pathway (GO: 0010737), n = 6 mice/group. B, Ucp1 gene expression in iWAT and iBAT. Data are means ± SEM, n = 9 mice/group except pair-fed group, n = 10 mice/group. Statistical analysis was performed by one-way ANOVA with Tukey’s multiple comparisons test. C, Gene expression in iBAT. Data are means ± SEM, n = 10 mice/group except GDF15 group, n = 9 mice. D, Gene expression in iWAT. Data are means ± SEM, n = 8 mice/group except vehicle group, n = 7 mice. E, Representative images of paraffin-embedded iWAT sections stained with H&E. F, Mean cell size of iWAT. Data are means ± SEM, n = 8 mice/group except vehicle group, n = 7 mice. G, Experimental scheme for the effect of GDF15 on body mass and energy expenditure in WT and an inducible model for deletion of the AMPKβ1 and β2 subunits in adipocytes (iβ1β2AKO) mice fed with western diet and housed at thermoneutrality. H, Body weight change. Data are means ± SEM, n = 5 mice/group (WT mice), n = 6 mice/group (iβ1β2AKO mice). P values by two-way ANOVA with Tukey’s multiple comparisons test. I, Average 12h-dark EE. Data are means ± SEM, n = 5 mice/group (WT mice), n = 6 mice/group (iβ1β2AKO mice). P values by one-way ANOVA with Tukey’s multiple comparisons test.

