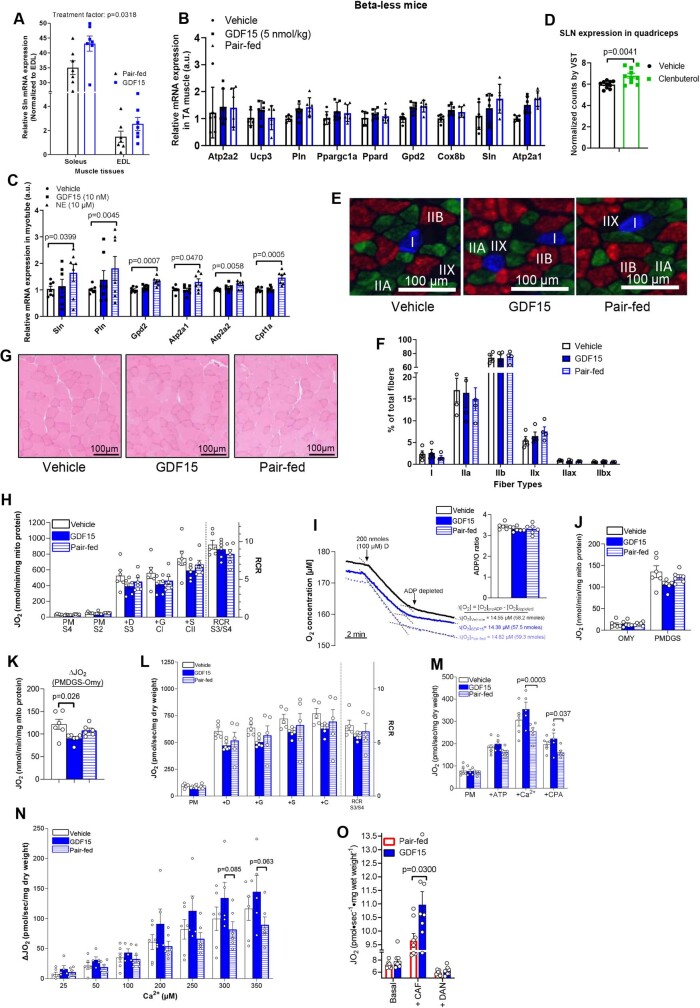
Extended Data Fig. 10. GDF15 increases beta-adrenergic signalling and mitochondrial respiration in skeletal muscle without change fibre type percentages and muscle structure.
A, Relative Sln gene expression level in soleus and extensor digitorum longus (EDL) muscle. Data are means ± SEM, n = 7 mice/group. P values of treatment factor was analysed by Mixed-effects model (REML, two-sided without adjustment). B, Relative expression level of Atp2a1, Atp2a2, Ucp3, Sln, Pln, Ppard, Gpd2, Cox8b and Pppargc1a in TA muscle from beta-less mice. n = 6 mice/group. C, Relative expression level of Atp2a1, Atp2a2, Sln, Pln, Gpd2, and Cpt1a in myotubes treated with vehicle, GDF15 and norepinephrine (NE). n = 7 biologically independent samples/group. P values by two-way ANOVA with Tukey’s multiple comparisons test. D, Sln expression in quadriceps isolated from mice treated with the vehicle or beta-2 agonist (Clenbuterol). Data are means ± SEM, n = 10 mice/group. P values by unpaired t test (two-sided). E, Representative immunohistochemical staining for fibre types in gastrocnemius. F, Muscle fibre type percentage. Data are mean ± SEM, n = 4 group. G, Representative images of frozen gastrocnemius muscle sections stained with H&E (4 mice/group). Within each gastrocnemius, the entire muscle cross-section was visualized and imaged to evaluate the whole cross-section in its entirety. H, Absolute mitochondrial respiration (JO2); S4: State 4 (pyruvate + malate), S2: State 2 (pyruvate + malate, depleted ADP), S3: State 3 (PMD (+max ADP)), CI: maximal CI respiration (PMDG (+max glutamate)), CII: maximal CII respiration (+max succinate), RCR: S3/S4. Data are means ± SEM, n = 6 mice/group. I, Representative trace of oxygen depletion in mitochondria in the presence of 100 μM (200 nmoles) ADP for determination of ADP/O ratios. Data are means ± SEM, n = 6 mice/group. J, Absolute mitochondrial JO2 with oligomycin and maximal CII supported respiration. OMY: JO2 with mitochondria + oligomycin (no substrates), CII: maximal respiration with PMDGS. Data are means ± SEM, n = 6 mice/group. K, Change in mitochondrial JO2 from OMY with PMDGS. Data are means ± SEM, n = 6 mice/group. P values by one-way ANOVA with Tukey’s multiple comparisons test. L, JO2 in permeabilized fibres in the presence and absence of ADP and various substrates. Data are means ± SEM, n = 5 mice/group except GDF15 group, n = 6 mice. M, Oxygen consumption (JO2) in permeabilized muscle fibres treated with (PM, Pyruvate + Malate, ATP, Ca2+ or CPA, cyclopiazonic acid). Data are means ± SEM, n = 6 mice/group except GDF15 group, n = 5 mice. P values by two-way ANOVA with Šídák’s multiple comparisons test. N, Change in JO2 during a calcium titration in permeabilized fibres. Data are means ± SEM, n = 6 mice/group except GDF15 group, n = 5 mice. P values by two-way ANOVA with Tukey’s multiple comparisons test. P- pyruvate; M - malate; D - ADP; G - glutamate; S - succinate; RCR - respiratory control ratio. O, Absolute JO2. Data are means ± SEM, n = 8 mice/group. P values by unpaired t test (two-sided).

