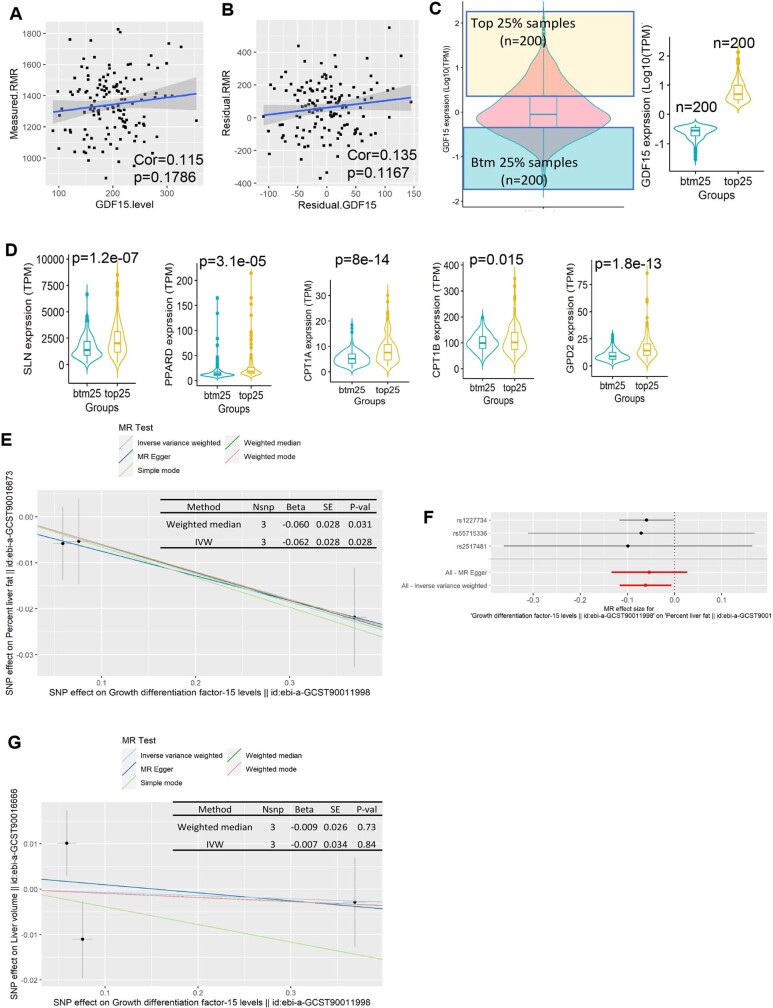
Extended Data Fig. 11. The relationship between GDF15 and resting metabolic rate (RMR) and NAFLD in humans.
A, Correlation between GDF15 levels and RMR in a population of healthy adults (n = 137 participants). The correlation analysis was performed using Pearson’s product-moment correlation (two-sided). B, the correlation between GDF15 levels correcting to weight and mass and RER after correction for fat mass, fat free mass and age from TANITA, by using our published equation Ln BEE = −0.954+0.707 Ln FFM +0.019 Ln FM. The correlation analysis was performed using Pearson’s product-moment correlation (two-sided). C, Distribution of GDF15 expression levels (log10(TPM)) from 806 muscle tissues for human subjects in GTEx. The yellow and blue boxes represent the top 25% (n = 200) and bottom 25% (n = 200) groups, respectively. The hinges correspond to first and third quartiles, the whiskers extend to the largest/smallest value, and the centre lines represent the median values. D, Relative expression level (TPM) of SLN, PPARD, CPT1A, CPT1B, GPD2. n = 200 human subjects per group. P values by unpaired t test (two-sided). The hinges correspond to first and third quartiles, the whiskers extend to the largest/smallest value, and the centre lines represent the median values. E, Scatter plot of the SNP-effect on GDF15 and SNP-effect on liver fat percentage in humans by using two sample Mendelian Randomization (2SMR). Error bars indicate 95% CI, n = 32,859 participants in UK Biobank. MR analysis was performed by using Simple median method, MR weighted mode estimator, Weighted median method, MR Egger regression, Inverse variance weighted methods. F, Single SNP analysis of GDF15 on liver fat percentage in human, Error bars indicate 95% CI, n = 32,859 participants in UK Biobank. G, Scatter plot of the SNP-effect on GDF15 and SNP-effect on liver volume in human. Error bars indicate 95% CI, n = 32,859 participants in UK Biobank. MR analysis was performed by using Simple median method, MR weighted mode estimator, Weighted median method, MR Egger regression, Inverse variance weighted methods.

