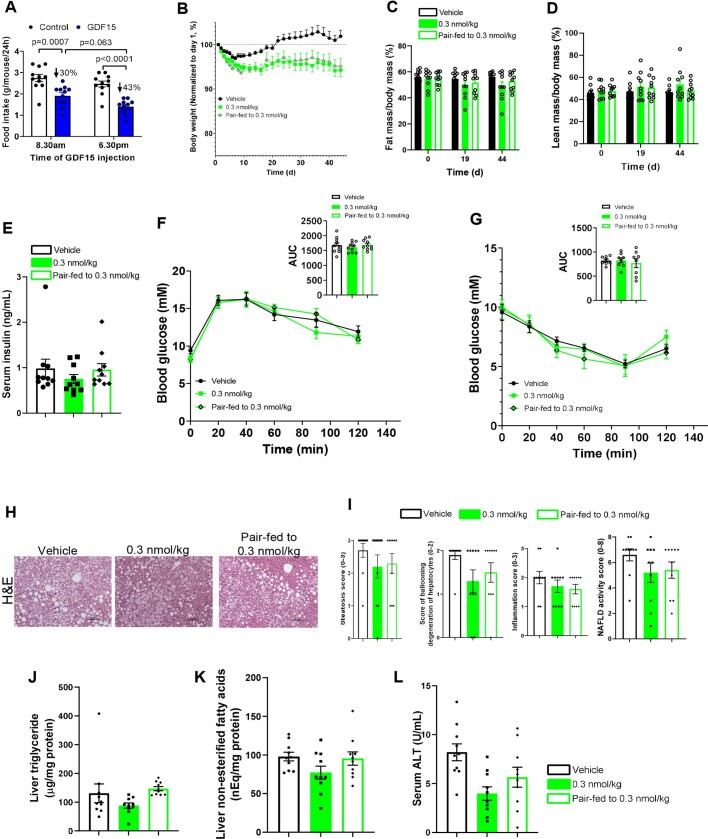
Extended Data Fig. 1. GDF15 at 0.3 nmol/kg has no effects on body weight, body composition, glucose homeostasis and NAFLD.
A, the influence of injection of mice on food intake at the start of the light/dark-cycle with GDF15 (5 nmol/kg). Data are means ± SEM, n = 10 mice/group. P values by two-way ANOVA with Tukey’s multiple comparisons test. B, Body weight. Data are means ± SEM, n = 10 mice/group. C, Fat mass/body mass (%). Data are means ± SEM, n = 10 mice/group. D, Lean mass/body mass (%). Data are means ± SEM, n = 10 mice/group. E, Serum insulin levels. Data are means ± SEM, n = 10 per group. F, Glucose tolerance test (GTT). Data are means ± SEM, n = 10 mice/group. G, Insulin tolerance test (ITT). Data are means ± SEM, n = 8 mice/group. H, Representative images of paraffin-embedded liver sections stained with H&E. I, Steatosis score, score of ballooning degeneration of hepatocytes, inflammation score, and NAFLD activity score. Data are means ± SEM, n = 10 mice/group. J, liver triglycerides (TG). Data are means ± SEM, n = 10 mice/group. K, Liver non-esterified free-fatty acids (NEFA). Data are means ± SEM, n = 10 mice/group. L, Serum alanine aminotransferase (ALT). Data are means ± SEM, n = 10 mice/group.

