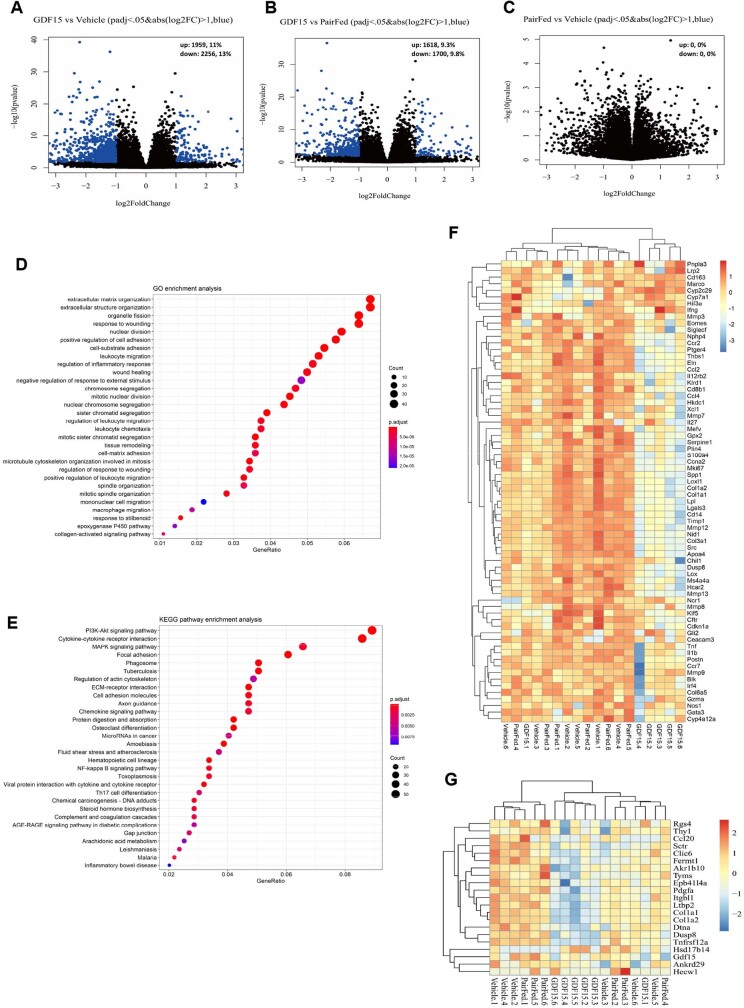
Extended Data Fig. 3. Liver transcriptomic analysis based on RNA-seq data.
A-C, Volcano plot showing differential expression genes (DEGs) identified between GDF15 and vehicle groups (A), GDF15 and pair-fed groups (B), and pair-fed and vehicle groups (C). n = 6 mice/group. Differential expression genes analysis with DEGseq2 is based on Wald test (two-sided, no adjustment). D, Top 30 terms in GO annotation involved in DEGs between vehicle and GDF15, n = 6 mice/group. Adjust-p value calculated by Benjamini-Hochberg method. E, Top 30 pathway by using KEGG pathway enrichment analysis. Adjust-p value calculated by Benjamini-Hochberg method. F, Hierarchical clustering by using the mouse fibrosis panel from NanoString. G, A hierarchical clustering of the liver RNA-seq data by using the 25-gene signature established31 in humans.

