
Fig. 3. Dynamics of camouflage transitions.
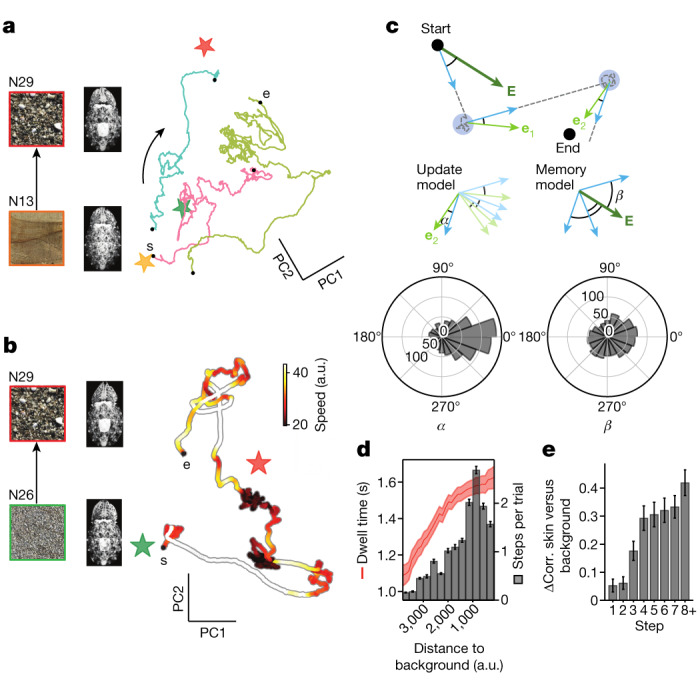
a, Exploratory trajectories (lengths, 40–126 s) in skin-pattern space (PC1, 15.2%; PC2, 13.1%) in response to the same background switches (N13 to N29). The stars represent the three background textures (N13 (orange), N26 (green) and N29 (red)). b, Speed profile of pattern change (colour) of one trajectory (length: 220 s) in response to background switch from N26 to N29. c, Test of two motion-direction models (update and memory) for motion in skin-pattern space. The dark green vectors point to the end goal from the starting point; the light green vectors point to the end goal from each intermediate slow point; the blue vectors show the actual motion direction when exiting each slow point. Data support the update model: the distribution of α is significantly biased to 0 (Rayleigh test, P < 10−10), but not that for β (Rayleigh test, P > 0.01). n = 85 trajectories, 3 animals on 3 backgrounds (N13, N26 and N29). d, The number of transitions (steps) between slow points per trial (grey) and the dwell time at slow points (red) increase as the skin pattern becomes more similar to the background. n = 868 slow points from 85 trajectories in 3 animals. Data are mean ± s.e.m. The x axis shows the distance (in top two PCs) from the skin pattern at each slow point to the background pattern (bins of 285 arbitrary units (a.u.)). e, The correlation (corr.) between skin and background patterns increases as the number of transitions (steps) between slow points increases (Methods). Ordinate plots change (Δ) in correlation between the skin and background compared with at behaviour onset. n = 85 trajectories, 3 animals.