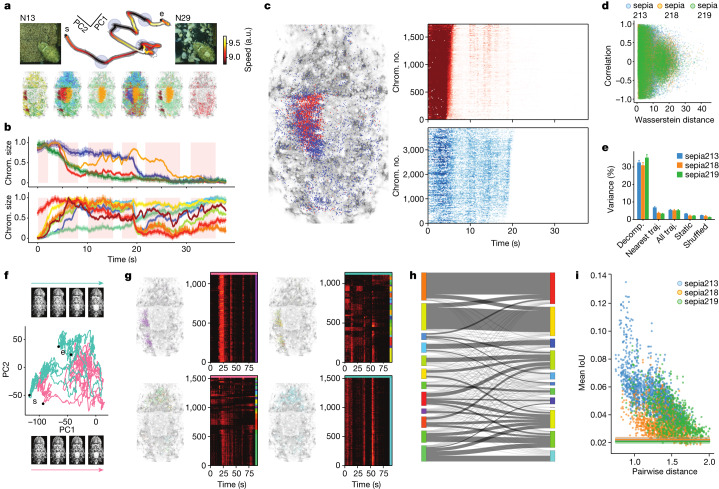
Fig. 4. Organization and reorganization of chromatophore groupings during pattern transitions.
a, Speed profile of a transition (background: N13 to N29) in chromatophore space (PC1–2: 15.6%, 9.8%) contained five slow points (blue, top). Groupings of chromatophores (coloured, bottom) that changed together (pattern components) during transitions between these points (1 of 3 analysed animals). b, Chromatophores (chrom.) in pattern components shrank (top row) or expanded transiently (bottom) during the transition in a. The pink shading shows the time of motion between slow points. c, Interdigitated groups of 1,736 (red) and 3,903 (blue) chromatophores, located in left half of the dorsal square, show different activity (right; average in b, top). The heat maps show the size of individual chromatophores (rows, z-scored). d, The correlation of activity between pattern components is not linked to their physical separation (Pearson’s r56,928 = −0.043, P = 4.34 × 10⁻²⁵; 3 animals; Wasserstein distance; Extended Data Fig. 7c–e). e, The variance explained (200 PCs) by the dataset in which PCs are defined. Decomp., same dataset; nearest, the most similar transition; all, all transitions, downsampled; static, activity at static patterns; shuffled, randomized groupings. n = 21, 18 and 21 trajectories (traj.) from 3 animals, 3 backgrounds (N13, N26 and N29). f, Trajectories (the same PCs as in a) and images for two similar transitions (teal, 87.2 s; pink, 87.1 s; backgrounds are the same as in a). g, Chromatophores (n = 1,123) that co-varied in the pink trial (purple cluster, g1, left) split into many clusters in the teal trial. Chromatophores (n = 1,532) that co-varied in the teal trial (teal cluster, g2, right) split in the pink trial. The heat maps show the size of individual chromatophores (rows, z-scored). h, Pattern-component reorganization. Groupings are based on activity in the pink (left) and teal (right) trials in f and g. The line thickness is proportional to number of shared chromatophores. i, The fractions of chromatophores that grouped consistently across pairs of trials. The mean intersection over union (IoU) of chromatophore groupings decreases as the distance between the transition pairs increases (n = 32.3 ± 0.5, 31.2 ± 0.9, 33.2 ± 0.4 clusters; 44, 32, 30 transitions; animals and backgrounds are as described in e; Extended Data Fig. 7f,g). The lines show shuffled groupings.

