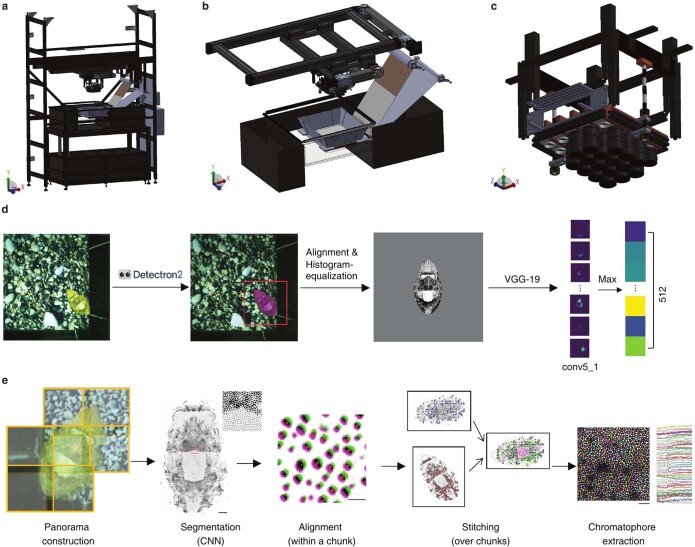
Extended Data Fig. 1. Schematic of experimental setup and analysis pipeline.
a. Full view of the live-in filming tank. b. Closer view of motorized camera array overlaying experimental arena and fabric roll with printed background images. c. Arrangement of 17 high-resolution filming cameras and one low-resolution camera (shorter lens, right corner). d. Analysis pipeline of low-resolution overview camera data (texture representation, see Methods). e. Analysis pipeline of high-resolution camera-array data to track single chromatophore activity (see Methods). Scale bars: Segmentation: 5,000 μm (816 μm for inset); Alignment: 200 μm; chromatophore extraction: 1,000 μm.

