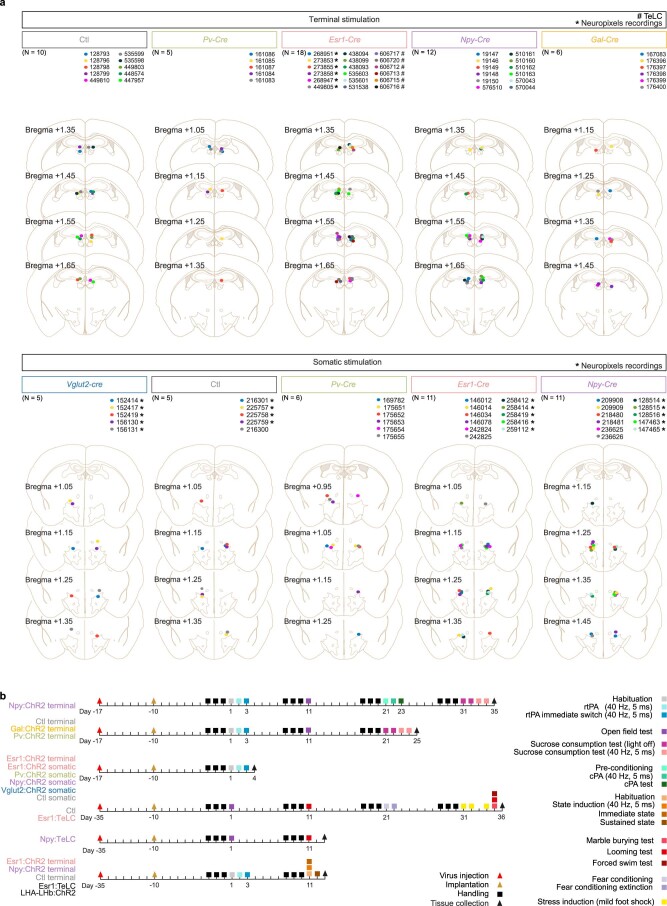
Extended Data Fig. 5. Confirmation of the position of optical fibers, and overview of experimental timelines.
(a) The location of the tip of the optical fibers across the experiments, visualized across the AP axis of coronal anatomical plates (Allen Brain Atlas CCFv2). Top: position of the tip of optical fibers in experiments with optogenetic stimulation of LHA-LHb axon terminals in the LHb. Bottom: position of the tip of optical fibers in experiments with somatic optogenetic stimulation of LHA-LHb neurons in the LHA. Colored dots: individual mice and their respective bilateral optical fiber location. *) mice subjected to Neuropixels recordings, #) mice subjected to TeLC silencing. (b) Schematic overview of the experimental timeline for the different cohorts of mice. N = number of mice.

