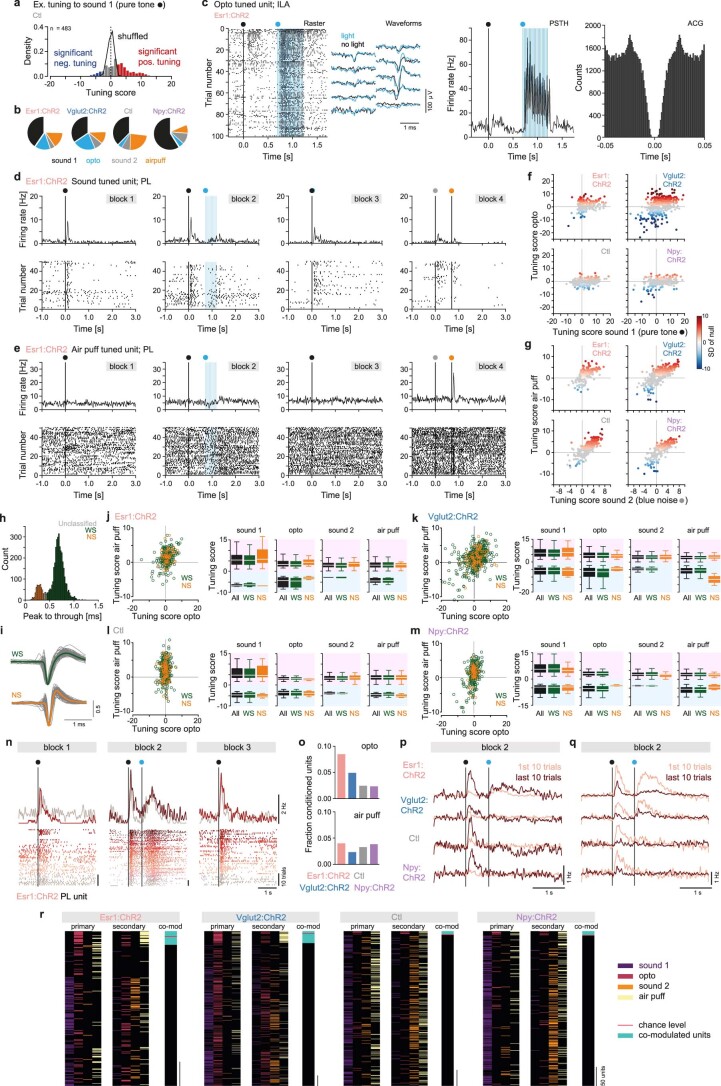
Extended Data Fig. 8. Tuning of mPFC units to sound, LHA-LHb pathway stimulation, and air puffs.
(a) Tuning scores for all units in Ctl mice (N = 5) fitted with the GLM (n = 482). The tuning to sound 1 (pure tone) is shown. Black curve: tuning scores expected by chance. (b) Pie charts of the proportions of primary tuning for all units fitted with the GLM. Ctl: n = 482; Vglut2:ChR2: n = 738; Npy:ChR2: n = 406, Esr1:ChR2: n = 319 units. (c) Example ILA unit in an Esr1:ChR2 mouse, significantly tuned to the optogenetic stimulation. From left to right: raster plot aligned to the onset of the sound; mean waveform during (blue) or outside of (black) light application on 10 neighboring recording channels; peri-stimulus-time-histogram (PSTH) aligned to the onset of the sound; auto-correlogram (ACG; bin size: 1 ms). Colored dots: block specific events; black: sound 1, blue: optogenetic stimulation, blue vertical lines: light pulses (5 ms). (d) Example PL unit in an Esr1:ChR2 mouse, significantly tuned to sound 1 (pure tone; block 1-3). Top: PSTHs, bottom: raster plots of 50 trials. Colored dots: block specific events; black: sound 1, blue: optogenetic stimulation, gray: sound 2, orange: air puffs. (e) As (d) but for an example PL unit in an Esr1:ChR2 mouse significantly tuned to air puffs (block 4). (f) Scatterplots of the tuning of all units fitted with the GLM (n = 1945) in response to optogenetic stimulation (y axis) vs sound 1 (pure tone; y axis). One dot = one unit. Units significantly tuned to optogenetic stimulation are color coded (standard deviation from the null distribution). Gray units: non-significant tuning. (g) As (f) but for sound 2 (blue noise) vs air puffs. Units significantly tuned to air puffs are color coded (standard deviation from the null distribution). Gray dots: units without significant tuning. (h) Distribution of the peak to through duration for all recorded mPFC units (n = 4152, N = 25). Units with narrow waveform (peak to through < 0.38 ms) were classified as narrow spiking units (NS, orange) and units with wide waveform (peak to through duration > 0.44 ms) as wide spiking (WS, green) units. (i) Mean waveform of the WS (green trace) and NS (orange trace) units, respectively. Gray traces: waveforms of 100 randomly picked units/cell type. All waveforms are peak normalized. (j-m) Left: scatterplots of the tuning of all WS (green) and NS (orange) units fitted with the GLM (Table 7 and 8) in response to optogenetic stimulation (x axis) vs air puffs (y axis) for Esr1:ChR2 (j), Vglu2:ChR2 (k), Ctl (l), and Npy:ChR2 mice (m), respectively. One circle = one unit. Right: The mean tuning scores of the significantly tuned units, showing the mean negative and mean positive tuning scores, respectively. Right, detail of the tuning scores (postive and negative tuning scores, All units: black, WS: green, NS: orange) for sound1, optogenetic stimulation, sound2 and air puff for each genotype. (n) Response profile of example PL unit in an Esr1:ChR2 mouse, across block 1-3. Top: PSTH, bottom: raster, both with color-coding of the trial progression within the blocks (lighter to darker, 10 trials/color). Colored dots: block specific events; black: sound 1, blue: optogenetic stimulation; vertical black lines: event onset. Bin size: 10 ms. (o) The fraction of conditioned units. Conditioned units displayed significantly (Wilcoxon signed rank-test) increased or decreased response to the sound and optogenetic manipulation in block 2 (top) or to the sound and air puffs in block 4 (bottom) over the trials within the respective block. (p) Mean response profile of the conditioned units that over the trials displayed significantly increased response to the sound in block 2. Mean of the first (light color) and last (dark color) 10 trials in block 2 are shown. Colored dots: block specific events; black: sound 1, blue: optogenetic stimulation, vertical black lines: event onset. Bin size: 10 ms. (q) As (p) but for the units that over the trials displayed significantly decreased response to the sound in block 2. (r) The primary and secondary tunings (to sound 1, optogenetic stimulation, sound 2, or air puff respectively), and the optogenetic/air puff co-modulation for all units fitted with the GLM (n = 1945). The units are grouped based on genotypes. Red bar: number of co-modulated units expected by chance. n = number of units, Ctl, VGlut2:ChR2, Npy:ChR2: N = 5, Esr1:ChR2: N = 10 mice in all panels with group data. All data acquired in male mice. For boxplots (j, k, l, m), data shown as median (center line), box (25th and 75th percentiles), whiskers (nonoutlier minimum and maximum) and outliers (>1.5 interquartile range).

