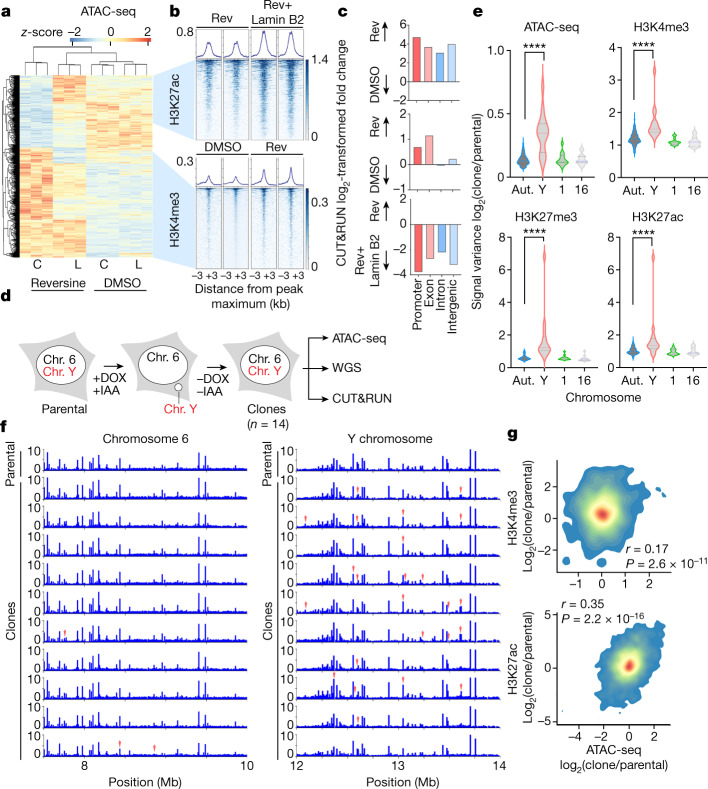
Fig. 4. CIN drives long-term changes in chromatin accessibility.
a, Heat map representing chromatin accessibility from ATAC-seq in control (C) or lamin-B2-overexpressing (L) TP53-knockout RPE-1 cells treated with reversine or DMSO; n = 3. b, Tornado plots from CUT&RUN analysis representing H3K27ac- and H3K4me3-bound chromatin in regions corresponding to the accessibility heat map shown in a; n = 3.Scales on the right side signify peak intensity. c, Log2-transformed fold change in the number of H3K4me3 (top), H3K27me3 (middle) and H3K27ac (bottom) CUT&RUN peaks on long-term reversine-treated (Rev) versus DMSO-treated TP53-knockout RPE-1 cells and those expressing lamin B2; graphs show pairwise comparisons. d, Experimental schematic representation depicting CEN-SELECT DLD-1 cell system used to generated Y-chromosome missegregation. Chromosome (Chr.) 6 is an example of a control autosome. e, Violin plots representing intraclonal variance from ATAC-seq, H3K4me3 CUT&RUN, H3K27me3 CUT&RUN and H3K27ac CUT&RUN across 10-kb segments in each of 14 DLD-1 clones. Aut., autosomes; Y, Y chromosome, Chr. 1 and Chr. 16. *****P < 0.00001, two-sided Mann–Whitney U-test, n = 14 clones of CEN-SELECT DLD-1 cells. f, Genome viewer plot showing copy-number-normalized ATAC-seq counts in a 2-kb region of chromosome 6 (control autosome) and the Y chromosome of DLD-1 CEN-SELECT parental control cells and the individual clones. Top row represents parental cells that did not undergo missegregation; the remaining rows represent single cell clones that underwent missegregation and transient micronucleation of the Y chromosome. Red arrows denote differentially accessible peaks. g, Density plot showing the comparison of the log2-transformed fold change in H3K4me3 CUT&RUN reads (top; r = 0.17, P = 2.6 × 10⁻¹¹) or H3K27ac CUT&RUN read counts (bottom; r = 0.35, P= 2.2 × 10⁻¹⁶) against ATAC-seq read counts in a given region between DLD-1 CEN-SELECT clones or parental cells; two-sided Spearman’s rank correlation statistics.

