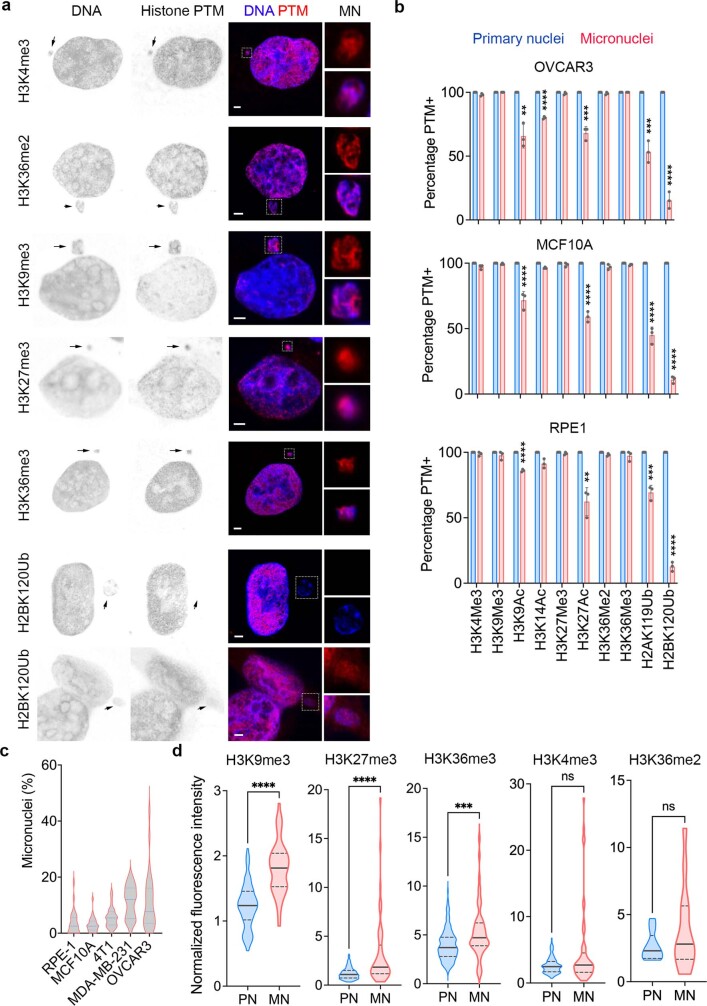
Extended Data Fig. 1. Micronuclei have distinct histone PTM profiles compared with primary nuclei.
a, Representative immunofluorescence images from 3 biological replicates of micronucleated MDA-MB-231 cells stained for DNA (blue) and histone posttranslational modifications (PTMs) (red), arrows point to micronuclei, scale bars 2 µm. Insets show magnified view of micronuclei (white outlined box). b, Percentage of primary nuclei and micronuclei with given histone PTMs from immunofluorescence experiment in OVCAR3, MCF10A, and RPE-1 cells, ** p < 0.01, *** p < 0.001, **** p < 0.0001, two-sided t-test, n = 3 biological replicates, bars represent mean ± SD. c, Violin plots showing the distribution of micronuclei percentage to primary nuclei in various cell lines used in the immunofluorescence quantification experiments. Values were obtained from 3 biological replicates. In each biological replicate, 10 fields of view under 63x magnification were observed. Solid and dashed lines in the plot represent the median and quartiles, respectively. d, Violin plots showing the normalized immunofluorescence intensity distribution of histone PTMs in: 55 micronuclei (MN) and 104 accompanying primary nuclei (PN) for H3K9Me3, 52 MN and 213 accompanying PN for H3K27Me3, 56 MN and 162 accompanying PN for H3K36Me3, 52 MN and 213 accompanying PN for H3K4Me3, 13MN and accompanying PN for H3K36Me2. Experiments were done on MDA-MB-231 cells; ns not significant, *** p < 0.001, **** p < 0.0001, two-sided Mann-Whitney test. Solid and dashed lines in the plot represent the median and quartiles, respectively.

