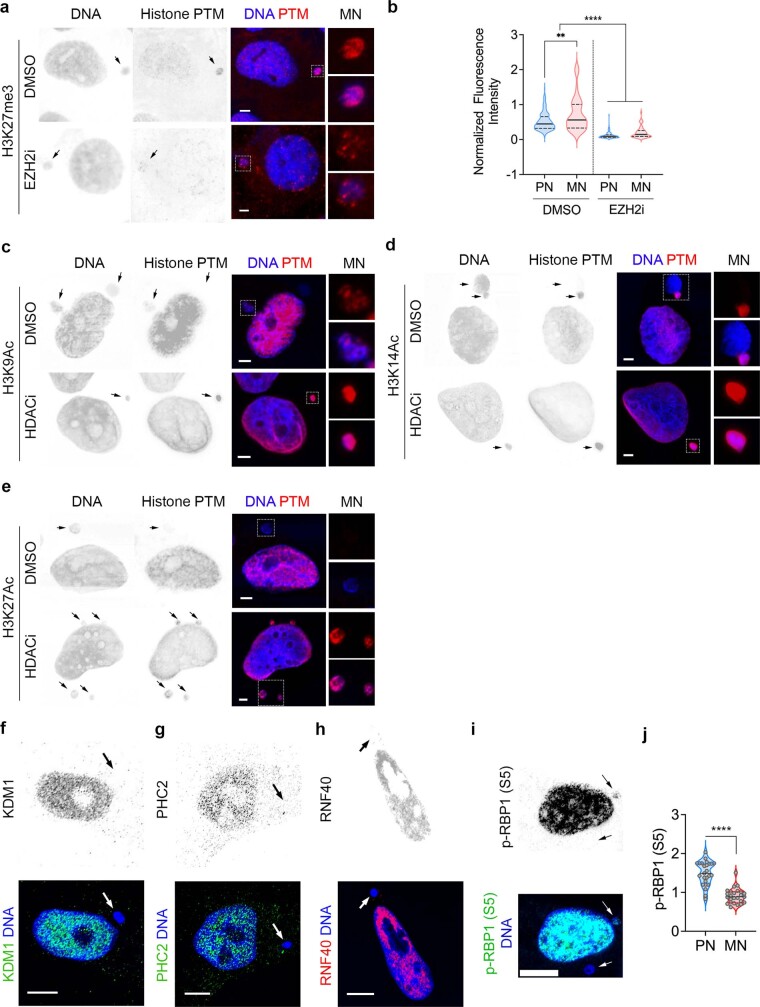
Extended Data Fig. 2. Epigenetic modifying drugs and epigenetic enzymes alter histone PTMs in micronuclei.
a, Representative immunofluorescence images from 3 biological replicates of micronucleated MDA-MB-231 cells stained for DNA (blue) and histone PTMs (red) treated with vehicle control (DMSO) or GSK126 EZH2 inhibitor (EZH2i), arrows point to micronuclei, scale bars 2 µm. Insets show magnified view of micronuclei (white outlined box). b, Violin plot showing normalized immunofluorescence intensity distribution of H3K27Me3 from immunofluorescence experiment in MDA-MB-231 cells. Cells were either treated with vehicle control (DMSO) or GSK126 EZH2 inhibitor (EZH2i); n = 52 micronuclei (MN) and 222 accompanying primary nuclei (PN) for DMSO-treated cells; n = 58 MN and n = 196 accompanying PN for EZH2i-treated cells; ** p < 0.01, **** p < 0.0001, two-sided Mann-Whitney test. Solid and dashed lines in the plot represent the median and quartiles, respectively. c–e, Representative immunofluorescence images from 3 biological replicates of micronucleated MDA-MB-231 cells stained for DNA (blue) and histone PTMs (red) treated with vehicle control (DMSO) or vorinostat HDAC Inhibitor (HDACi). Arrows point to micronuclei, scale bars 2 µm. Insets show magnified view of micronuclei (white outlined box). f–h, Representative immunofluorescence image from 3 biological replicates of micronucleated MDA-MB-231 cells stained for DNA (blue) and various epigenetic enzymes/complex members; f: KDM1 (green), g: PHC2 (green), h: RNF40 (red). Arrows point to micronuclei. Scale bars 2 µm. i, Representative immunofluorescence image from 3 biological replicates of micronucleated MDA-MB-231 cells stained for DNA in blue and phospho-RPB1 carboxy-terminal domain (serine 5), a functionally active RNA polymerase II (RNAPII) subunit, in green. Arrows point to micronuclei. Scale bars 2 µm. j, Violin plots showing normalized immunofluorescence intensity distribution of phospho-RPB1 carboxy-terminal domain (serine 5) from immunofluorescence experiment in MDA-MB-231, n = 25 MN and PN, **** p < 0.0001, two-sided Mann-Whitney test. Solid and dashed lines in the plot represent the median and quartiles, respectively.

