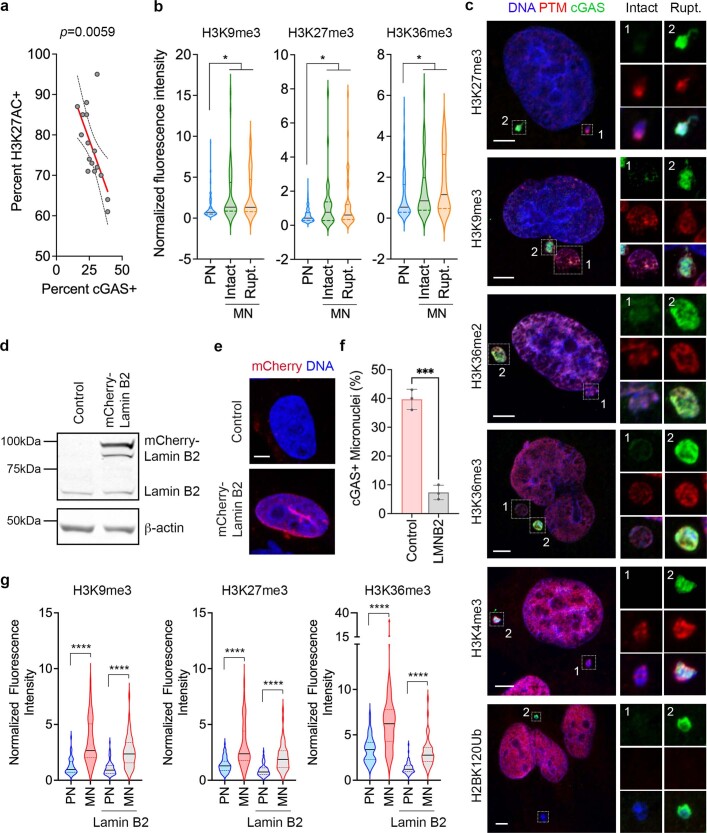
Extended Data Fig. 4. Impact of micronuclear rupture on histone PTMs.
a, Sample-level correlation between percentages of micronuclei with H3K27ac and cGAS staining in human high grade serous ovarian cancer (HGSOC) tumor samples (n = 16), 100 micronuclei counted/sample. statistical significance tested using two-sided t-test, no adjustments made for multiple comparisons. b, Violin plot showing normalized immunofluorescence intensity of histone PTMs in MDA-MB-231 cells’ PN, intact MN or ruptured (rupt.) MN; * p < 0.05, two-sided Mann-Whitney test). For H3K9Me3: n = 209 PN, 45 intact MN, and 51 ruptured MN; for H3K27Me3: n = 388 PN, 36 intact MN, and 53 ruptured MN; for H3K36Me3: n = 213 PN, 54 intact MN, and 39 ruptured MN. Solid and dashed lines in the plot represent the median and quartiles, respectively. c, Representative immunofluorescence images from 3 biological replicates of micronucleated MDA-MB-231 cells stained for DNA (blue), histone PTMs (red), and cGAS (green), scale bars 10 µm. Insets show magnified view of micronuclei (white outlined box). d, Representative immunoblotting results from 3 biological replicates of lamin B2 in control and mCherry-lamin B2 overexpressing MDA-MB-231 cells with β-actin as loading control. e, Representative immunofluorescence image of control and mCherry-lamin B2 overexpressing MDA-MB-231 cells stained with DNA (blue), scale bar 10 µm. f, Percentage of micronuclei with cGAS positive immunofluorescence staining in control and mCherry-lamin B2 overexpressing MDA-MB-231 cells (LMNB2); *** p < 0.001, two-sided t-test, n = 3 biological replicates, bars represent mean ± SD. g, Violin plot showing normalized immunofluorescence intensity of histone PTMs in primary nuclei (PN) and micronuclei (MN) of control and mCherry-lamin B2 (lamin B2) overexpressing MDA-MB-231 cells. For H3K9Me3: n = 99 PN (WT), 53 MN (WT), 73 PN (lamin B2), and 55 MN (lamin B2); for H3K27Me3: n = 73 PN (WT), 50 MN (WT), 82 PN (lamin B2), and 56 MN (amin B2); for H3K36Me3: n = 50 PN (WT), 50 MN (WT), 68 PN (lamin B2), and 50 MN (lamin B2); **** p < 0.0001, two-sided Mann-Whitney test, solid and dashed lines in the plot represent the median and quartiles, respectively.

