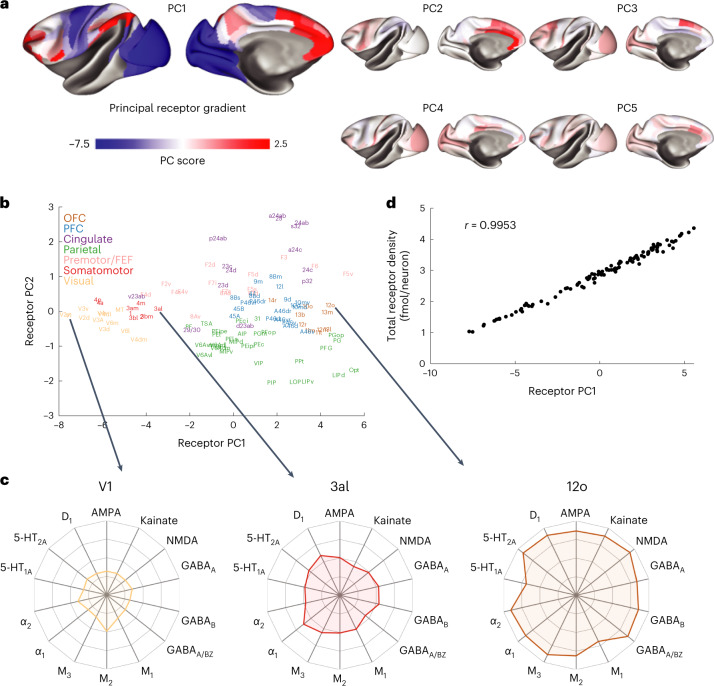
Fig. 2. The principal receptor gradient captures total receptor density per neuron across macaque cortex.
a, The first five PCs of the receptor per neuron data. b, The projection of brain regions onto the first two PCs of the receptor data (‘receptor space’). Brain regions are colored according to anatomo-functional groups for visualization purposes. c, The receptor fingerprints of three areas at different points along the first PC (that is, the principal receptor gradient). The density of most receptors increases along the gradient, from area V1 to 3al and again to 12o. For information on standard deviations, see Supplementary Table 2. d, The first PC closely follows the total receptor density per neuron. Pearson correlation, r(107) = 0.9953 (range: lower/upper bound of 95% confidence interval = 0.9931/0.9968, two-sided P = 4 × 10−110). OFC, orbitofrontal cortex; PFC, prefrontal cortex.

