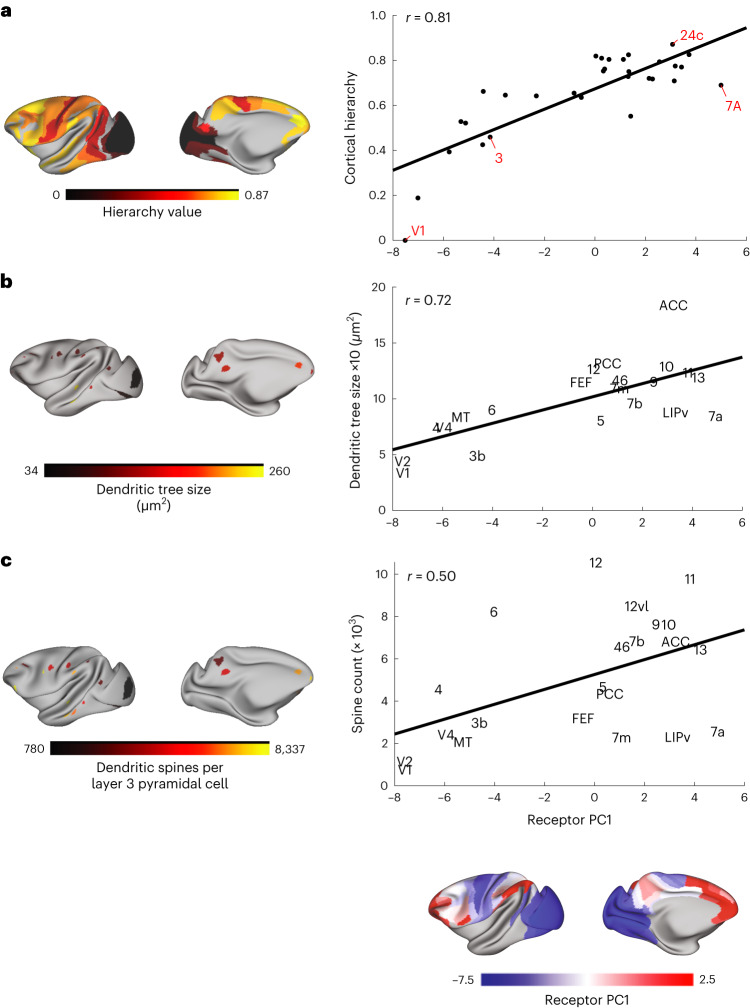
Fig. 3. The anatomical foundations of the principal receptor gradient.
a, There is a strong positive correlation between the principal receptor gradient and the cortical hierarchy (Pearson correlation, r(39) = 0.81 (range 0.64–0.90), P < 0.0001, corrected for spatial autocorrelation and multiple comparisons (Bonferroni)). b, Dendritic tree size is positively correlated with the principal receptor gradient (Pearson correlation r(19) = 0.73 (range: 0.43–0.88), P = 0.005, corrected for spatial autocorrelation and multiple comparisons (Bonferroni)). c, The relationship between the receptor principal receptor gradient and spine count is not significant after correction for spatial autocorrelation and multiple comparisons (Pearson correlation, r(20) = 0.54 (range: 0.15–0.78), P = 0.23, corrected for spatial autocorrelation and multiple comparisons (Bonferroni)).

