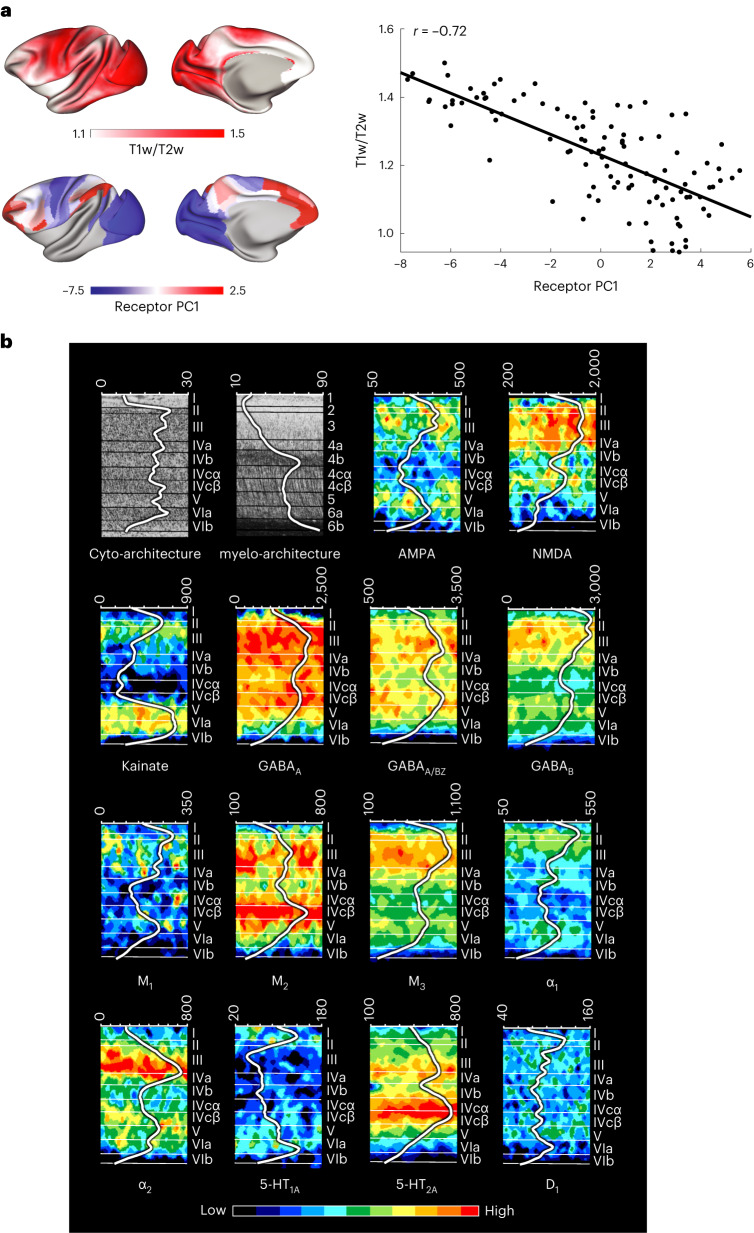
Fig. 4. An inverse relationship between cortical myelin and receptor density.
a, Cortical T1w/T2w ratio, a proposed marker for myelin content, is strongly negatively correlated with the principal receptor gradient across 109 cortical areas (r(107) = −0.72 (range: −0.80 to −0.62), P = 0.02, corrected for spatial autocorrelation and multiple comparisons (Bonferroni)). b, Receptor-, cyto-architecture and myelo-architecture of the macaque primary visual cortex (V1). Changes in Gray Level Index, which represents a measure of the volume fraction of cell bodies, in myelin density and in receptor concentration (in fmol mg−1 of protein) throughout the cortical depth are provided by the profile curve overlaid onto each section. Note that the scale has been optimized for each profile to provide the best visualization of changes in receptor densities throughout the cortical ribbon. Roman and Arabic numerals indicate cyto-architectonic and myelo-architectonic layers, respectively. Positions of cyto-architectonic layers were transferred to the neighboring receptor images.

