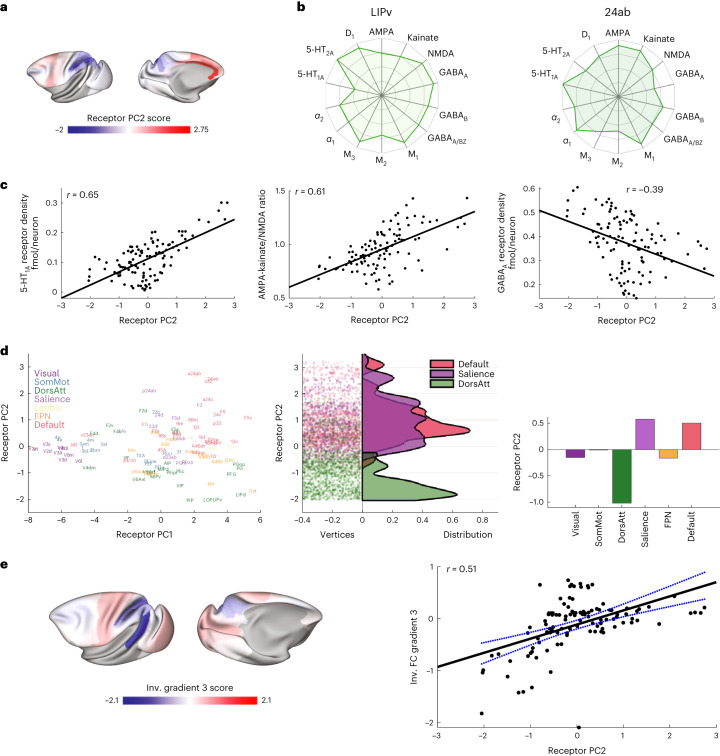
Fig. 6. The secondary receptor gradient tracks differences in serotonin receptor densities between higher cognitive areas of cortex.
a, Receptor PC2 (the secondary receptor gradient). b, Receptor fingerprints of areas 24ab and LIPv, which occupy opposing positions along the secondary gradient. The total receptor density per neuron is similar between the two areas, but there is an obvious difference in 5-HT1A receptor density per neuron. For information on standard deviations, see Supplementary Table 2. c, Receptor PC2 was positively correlated with 5-HT1A receptor density and the ratio of AMPA and kainate to NMDA receptors. Receptor PC2 was also negatively correlated with the GABAA receptor density (Pearson r correlation). d, The secondary receptor gradient separates the dorsal attention network from the default mode and salience networks. Left, cognitive networks in receptor space. Middle, distribution of receptor PC2 scores within the default mode, salience and dorsal attention networks. Right, mean receptor PC2 scores for each cognitive network. Inv., inverse. e, Left, the third functional connectivity gradient. Right, the secondary receptor gradient was strongly correlated with the third functional connectivity gradient. The error bars in d (right) show the 95% upper and lower bounds of the linear fit (r(107) = 0.51 (range: 0.35–0.63), P = 0.0246 corrected for spatial autocorrelation and multiple comparisons (Bonferroni)).

