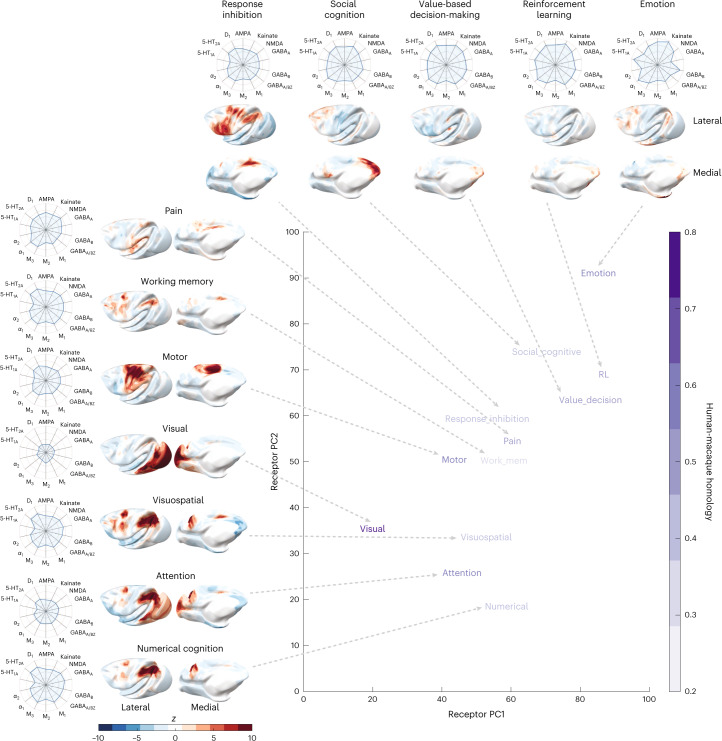
Fig. 8. Receptor expression in functionally defined networks.
Representative activation patterns for 12 functions were generated using the automatic meta-analysis software NeuroQuery. These activation maps were transformed from the human cortex to the macaque cortex using cross-species functional alignment. Each functional map is located within the two-dimensional receptor space according to the spatial overlap with the receptor gradients. The intensity of purple for each term within the plot corresponds to the estimated human–macaque homology. For each function, the receptor fingerprint plots on the outside show the average receptor density across significantly activated vertices. RL, reinforcement learning.

