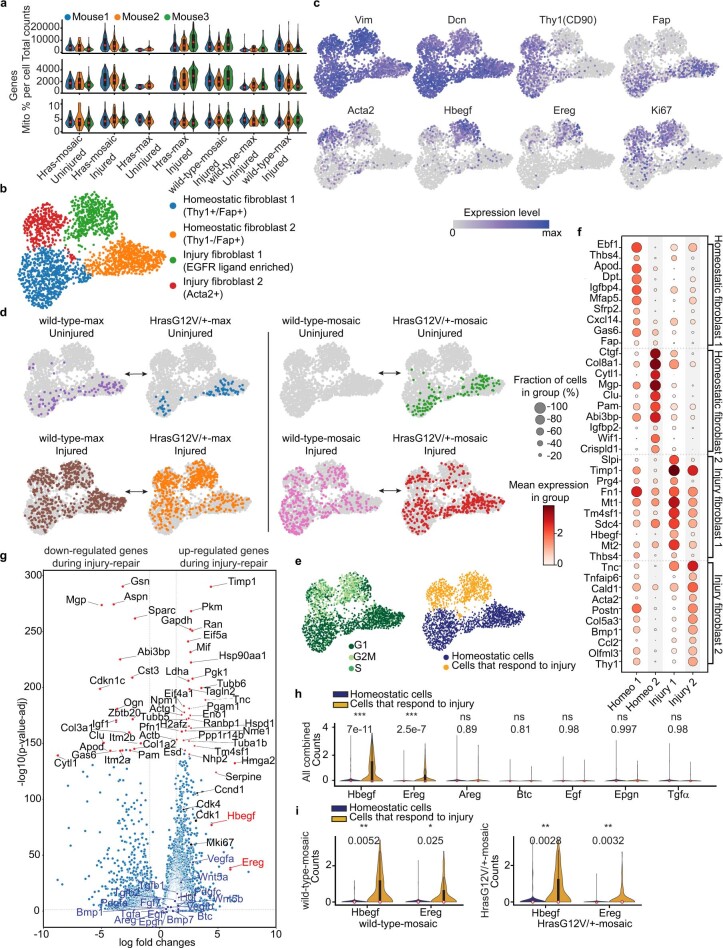
Extended Data Fig. 6. scRNA-seq fibroblast subcluster analysis reveals increased EGFR-ligand expression upon injury.
a) Violin plots showing quality control metrics for each individual sample. b) Unsupervised clustering of sampled fibroblasts74. c) Marker gene expression in fibroblast subclusters overlaid on UMAP. d) Distribution of cells from different mouse models among fibroblast clusters (n = 3 mice for each condition). Grey dots denote all cells. HrasG12V/+ and wild-type models have a similar distribution of cells in four clusters, depending on the tamoxifen treatment and the presence or not of the wound. e) UMAP showing cell-cycle classification (left) and injury response status (right). f) Dot-plot showing marker gene expression for the fibroblast subclusters. g) Volcano plot of differential gene expression profiles between fibroblasts from homeostatic and injured conditions showing the magnitude on the x-axis (Log2 fold change) and significance on the y-axis (-Log10 adjusted p-value, Wilcoxon rank-sum test with Benjamini-Hochberg correction). Red dots mark the 50 highest differentially expressed genes. Red names highlight the highest differentially expressed growth factors that affect epithelial cell behaviors. Blue dots with blue names represent other growth factors that take part in injury-repair and black dots with black names indicate genes involved in cell proliferation. h) Violin plots of EGFR ligands that affect epithelial cell behaviors75. Analysis is based on all mouse models combined. i) Violin plots that compare homeostatic and injury-responsive cells for the expression of EGFR ligands with a significantly different expression in (h). n = 3 mice per group. (a, h, i) Internal box plots denote the 25%, 50% and 75% quartiles with whiskers depicting the minima and maxima of the data, excluding outliers that are beyond 1.5x interquartile range. Statistics: two-tailed t-test comparing the averages of biological replicates according to conditions. (a-h) n = 24 independently sequenced mice (3 mice per condition and genotype, note that some samples did not contain fibroblasts; ‘mosaic samples’ are the same as in Extended Data Fig. 4).

