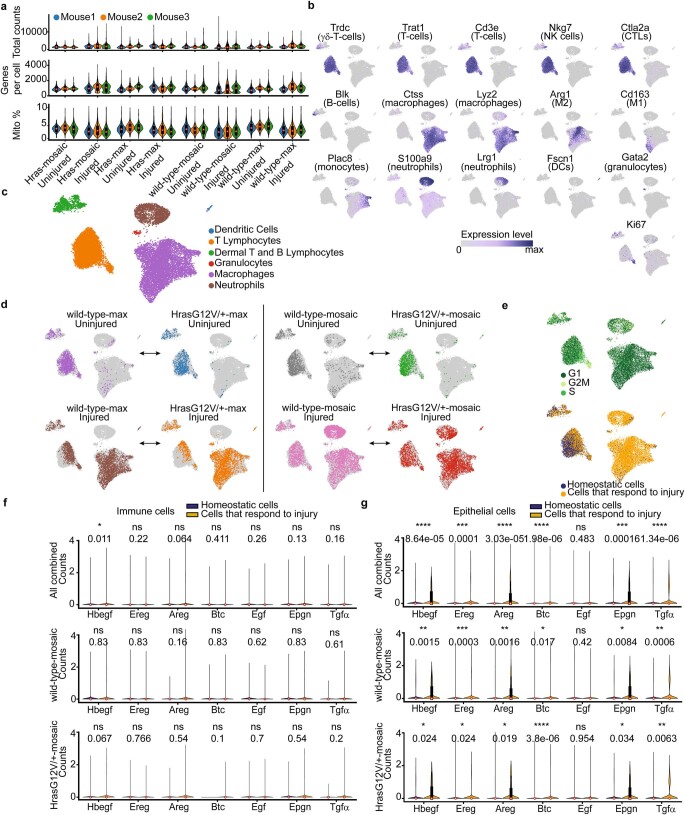
Extended Data Fig. 7. scRNA-seq immune cell subcluster analysis shows limited EGFR-ligand expression upon injury.
a) Violin plots showing quality control metrics for each individual sample. b) Annotation of cluster identities based on marker gene expression76. c) Unsupervised clustering of sampled immune cells (see Methods)76. d) Distribution of cells from different mouse models among the identified immune cell clusters (n = 3 mice for each condition). e) UMAP representations of cell cycle classification (top) and injury status of the dataset (bottom). f) Violin plots showing immune cell EGFR ligand expression for all datasets combined (n = 24 mice, top) and comparison between wild-type-mosaic and HrasG12V/+-mosaic datasets (n = 6 mice per group, bottom). g) Violin plots showing epidermal (i.e.: IFE) EGFR ligand expression for all datasets combined (n = 12 mice, top) and comparison between wild-type-mosaic and HrasG12V/+-mosaic datasets (n = 6 mice per group, bottom). (a, f, g) Internal box plots denote the 25%, 50% and 75% quartiles with whiskers depicting the minima and maxima of the data, excluding outliers that are beyond 1.5x interquartile range. (f, g) Statistics: two-tailed t-test comparing the means of biological replicates according to conditions. (a-f) n = 24 independently sequenced mice (3 mice per condition and genotype; ‘mosaic samples’ are the same as in Extended Data Figs. 4, 6).

