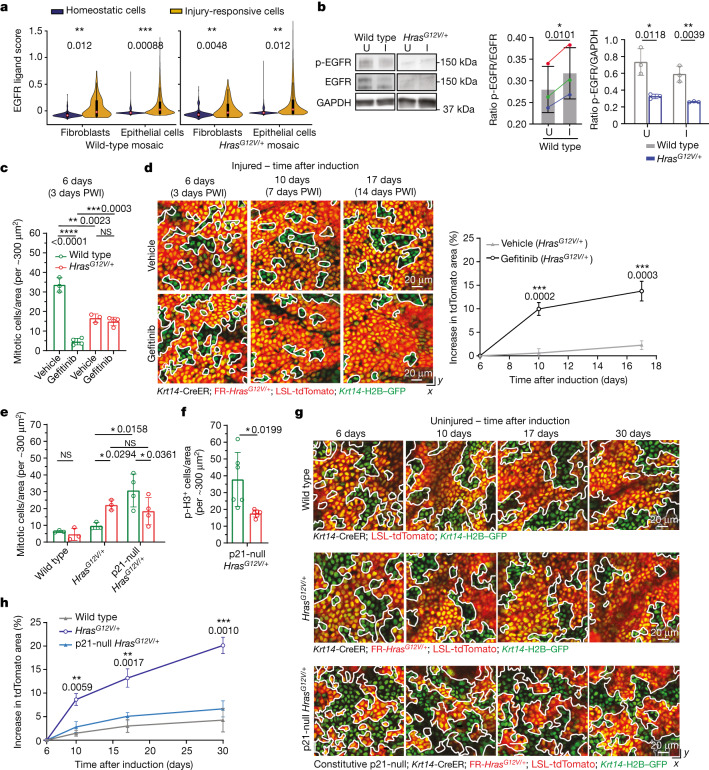
Fig. 5. Increased proliferation of wild-type cells is sufficient to counteract expansion of HrasG12V/+ cells in mosaic skin.
a, Violin plots showing cell scoring based on expression of EGFR ligands (Extended Data Fig. 6i), separated by cell type and genotype. Two-tailed t-test comparing the averages of biological replicates according to conditions (fibroblasts: n = 3 wild-type mosaic and n = 6 HrasG12V/+ mosaic; epithelial cells n = 6 mice per genotype), P values are shown. Internal box plots denote the 25th, 50th and 75th centiles, with whiskers depicting minima and maxima, excluding outliers that are beyond 1.5× the interquartile range. b, Western blot analysis (left) and quantification (middle) of phosphorylated EGFR (p-EGFR) and total EGFR in injured and uninjured conditions (n = 3 mice). Paired, two-tailed t-test. Pairs of coloured dots represent ratios for individual mice. Right, western blot analysis of total EGFR normalized to GAPDH (n = 3 mice). Blots were processed at the same time. Unpaired, two-tailed t-test. c, Quantification of mitotic cells in tdTomato+ and tdTomato− areas. d, Left, representative two-photon revisit images following injury. Right, the increase in tdTomato+ area after tamoxifen induction. In c,d, vehicle, n = 3 mice; Gefitinib, n = 4 mice. e, Quantification of mitotic cells in tdTomato+ and tdTomato− areas in wild-type mosaic (n = 3 mice), HrasG12V/+ mosaic (n = 3 mice) and constitutive p21-null HrasG12V/+ mosaic (n = 4 mice). f, Quantification of p-histone H3-positive cells in tdTomato+ and tdTomato− areas (n = 6 mice). g, Representative two-photon revisit images following injury in wild-type mosaic, HrasG12V/+ mosaic and constitutive p21null-HrasG12V/+ mosaic mice. h, The increase in tdTomato+ area. Unpaired, ordinary one-way ANOVA comparing wild-type mosaic, HrasG12V/+ mosaic and constitutive p21null-HrasG12V/+ mosaic at different time points in the uninjured condition. In g,h, n = 3 wild-type mosaic mice, n = 3 HrasG12V/+ mosaic mice and n = 4 constitutive p21null-HrasG12V/+ mosaic mice. c–f, Unpaired or paired two-tailed t-test for comparisons between different groups or within the same group of mice. P values are shown. At least three independent areas of approximately 300 µm2 were analysed for each mouse (Methods). Data are mean ± s.d.

