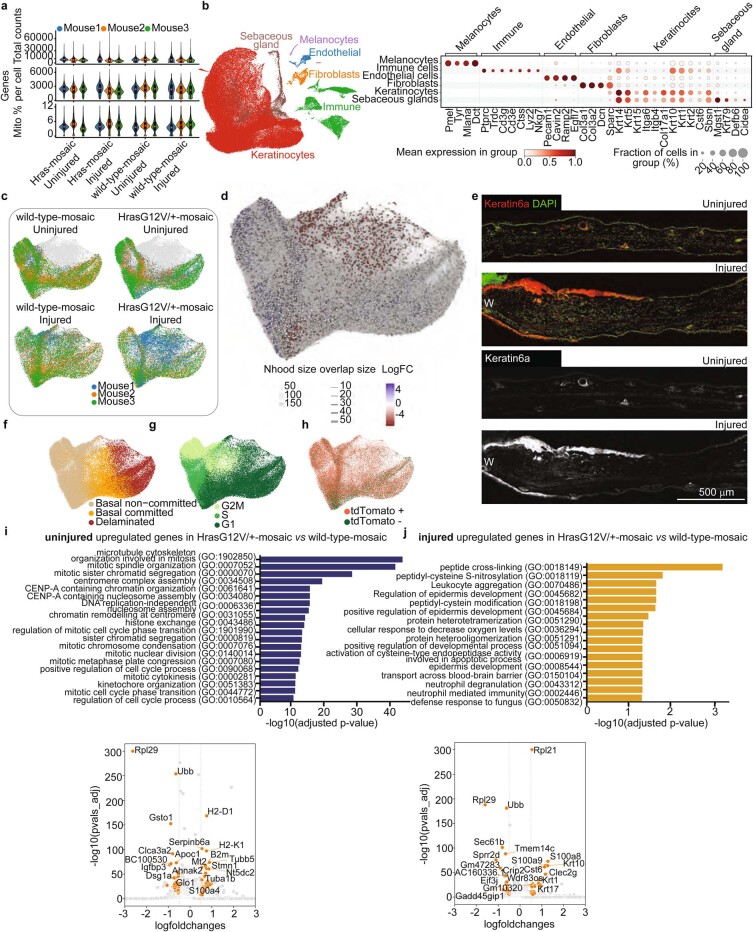
Extended Data Fig. 4. Characterization of scRNA-seq datasets of wild-type-mosaic and HrasG12V/+-mosaic cells in uninjured or injured condition.
a) Violin plots showing quality control metrics for each sample. All the box plots within violin plots denote the 25%, 50% and 75% quartiles with whiskers depicting the minima and maxima of the data, excluding outliers that are beyond 1.5x interquartile range. b) UMAP displaying the main cell populations of the integrated dataset (left), and dot-plot showing characteristic marker-gene expression (right). c) UMAPs showing the distribution of interfollicular epidermal (IFE) keratinocytes of the different conditions, coloured according to biological replicates. Grey cells denote all keratinocytes. d) Abstracted graph of neighbourhoods superimposed on IFE UMAP, showing differential abundance testing results from MiloR68. Node sizes represent the size of the neighbourhood and edges indicate number of cells common between neighbourhoods. Neighbourhoods displaying significant differential abundance are coloured according to the log-foldchange of the differential abundance testing. e) Micrographs showing Keratin6a protein expression in uninjured and injured ear tissue. W – wound, scale bar, 500 μm. n = 3 mice. f, g, h) UMAPs showing cell classification into basal non-committed, basal committed, and delaminated populations (f), cell cycle phase (g) and cell classification based on tdTomato expression (h). i, j) Bar plots showing top GO terms (upper) for differentially up-regulated genes comparing HrasG12V/+ and wild-type-mosaic cells in uninjured (i) or injured (j) condition. Respective differential gene expression analysis is shown on volcano plots (lower) with log2 fold-changes on x-axis and -log10(adjusted p-values) on y-axis. Genes were considered differentially expressed (orange dots) when they were expressed in >25% of cells in each of the compared biological replicate, had absolute log-foldchange > 0.5 and adjusted p-value < 0.05 (Wilcoxon rank-sum test with Benjamini-Hochberg correction). a-d, f-j) n = 12 independently sequenced mice (3 mice per condition and genotype).

