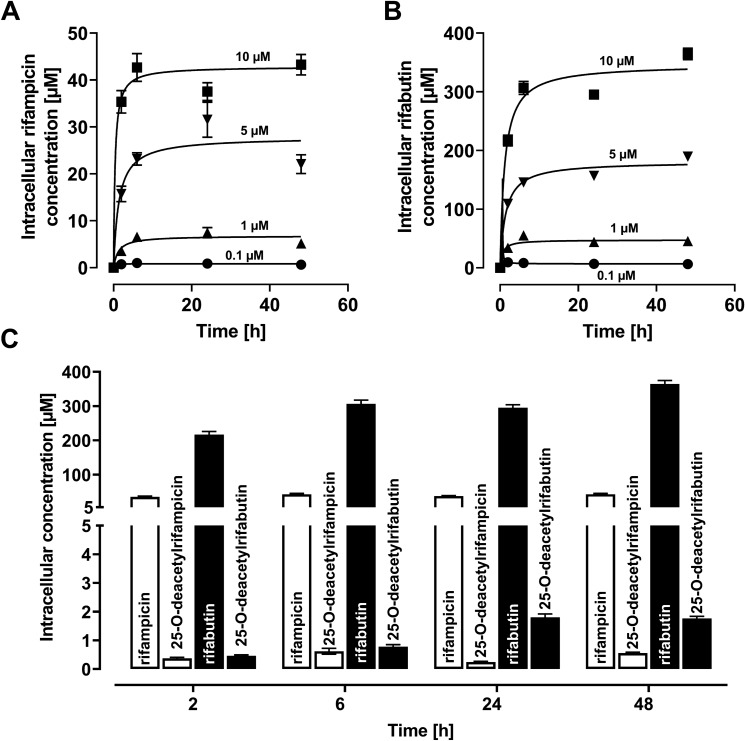
Fig. 1.
Intracellular concentrations of rifampicin (A) or rifabutin (B) in LS180 cells after drug exposure for 2, 6, 24, or 48 h (0.1 µM = circles; 1 µM = triangles, up; 5 µM = triangles, down; 10 µM = squares). Data points were fitted according to a hyperbola model. C Intracellular concentrations of rifampicin and its metabolite 25-O-deacetylrifampicin (light bars) or rifabutin and its metabolite 25-O-deacetylrifabutin (dark bars) after exposure to 10 µM parent drug for 2, 6, 24, or 48 h. Data shown are the mean ± SEM of four independent biological replicates

