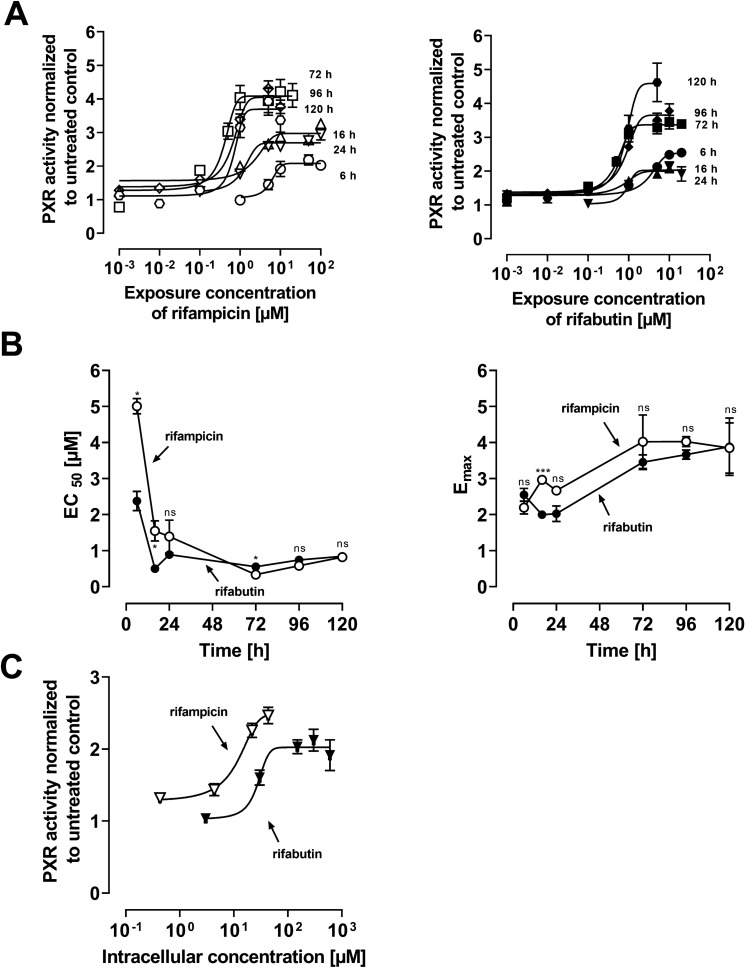
Fig. 2.
Relative pregnane × receptor (PXR) reporter activity in LS180 cells after rifamycin treatment. Data shown are the mean ± SEM of three independent biological replicates with n = 4 replicates for each concentration. EC50 and Emax values were calculated according to an Emax model (four parameter-logistic equation; variable slope). A PXR activation after 6, 16, 24, 72, 96, or 120 h exposure to rifampicin (left) or rifabutin (right). B EC50 data (left) and Emax data (right) of PXR activation for each timepoint after rifampicin (open circles) or rifabutin (filled circles) treatment. Data points are simply connected. Significant differences in EC50 and Emax between the drugs at the respective timepoint were evaluated by Student’s t test using GraphPad Prism version 9.1; *P < 0.05, ***P < 0.001, ns = not significant. C Relative PXR activity in LS180 cells after intracellular exposure to rifampicin (open circles) or rifabutin (closed circles) for 24 h

