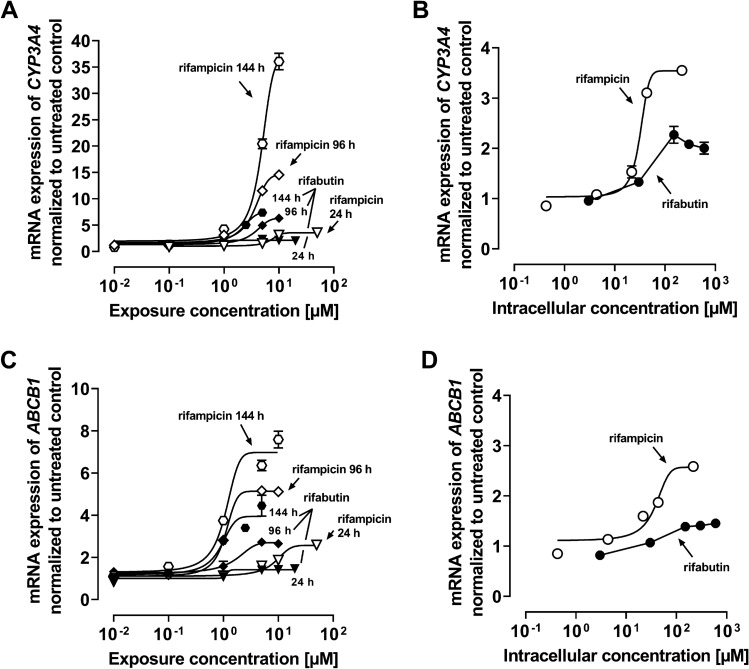
Fig. 3.
mRNA expression of CYP3A4 (A) or ABCB1 (C) in LS180 cells after exposure to rifampicin (open symbols) or rifabutin (filled symbols) for 24, 96, and 144 h. mRNA expression of CYP3A4 (B) and ABCB1 (D) in LS180 cells after exposure to rifampicin (open symbols) or rifabutin (filled symbols) for 24 h, normalized to intracellular concentrations. Data shown are the mean ± SEM of four independent biological replicates. Data were fitted according to an Emax model (four parameter-logistic equation; variable slope). Data points for rifabutin in part (B) and (D) were simply connected, because fitting was not possible. Individual EC50 and Emax values are listed in Supplemental Material Table S5

