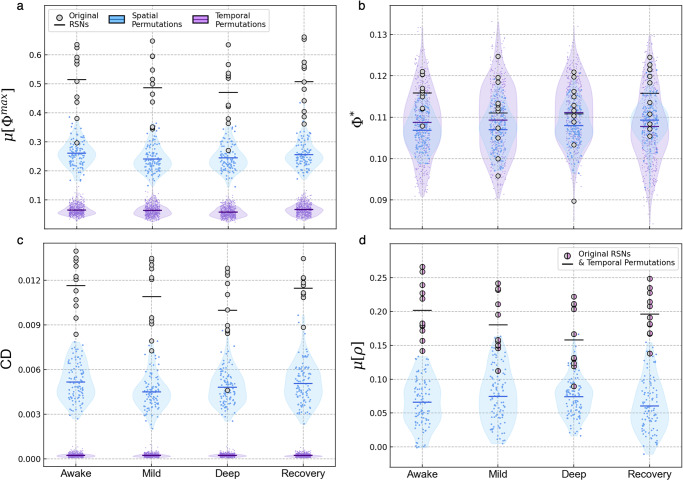
Fig. 2. Results from spatial and temporal control procedures.
For each of the four conditions, we generated 100 spatial control networks by randomly grouping five regions from different RSNs. Each RSN’s time-series was then randomly permuted 50 times in the temporal control procedure, leading to 550 randomized time-series for 11 RSNs in each condition. Note that these permutations and calculations were performed for time-series with all 17 subjects concatenated (see Methods for more details). We computed μ[Φmax] (a), Φ* (b), (c), and μ[ρ] (d) for the original RSNs (shown with the gray points) and both control permutations (shown with the violin plots). The horizontal lines corresponding to each distribution represent their mean. In the case of μ[ρ] (d), the overlapped data points indicate that the original RSNs’ values did not change when time points were permuted. For source data, see Supplementary Data 2. For statistical information, see Supplementary Note 6, Supplementary Table 3.

