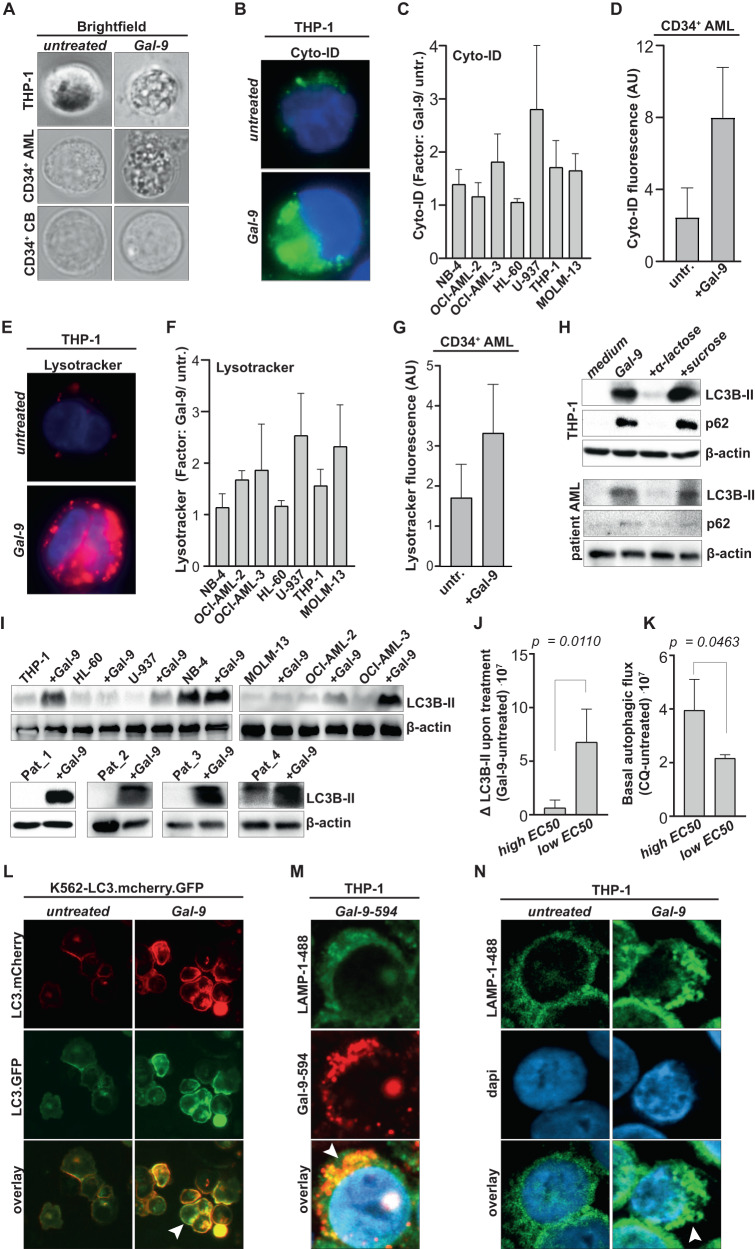
Fig. 4. Gal-9 inhibits autophagy in AML cells.
A Images of AML cells (THP-1 and patient-derived CD34+ cells) and CB-derived CD34+ cells upon treatment with Gal-9 (300 nM, 16 h), analyzed with fluorescent microscopy. B image of THP-1 cells upon treatment with Gal-9 (300 nM, 16 h) and stained with Cyto-ID, analyzed with fluorescent microscopy. C As in (B) whereby the fluorescent signal was quantified using ImageJ for the AML cell line panel (n = 3). D as in (C) but using CD34+ patient-derived AML cells (n = 5). E Image of THP-1 cells upon treatment with Gal-9 (300 nM, 16 h) and stained with Lysotracker, analyzed with fluorescent microscopy. F As in (E), whereby the fluorescent signal was quantified using ImageJ for the AML cell line panel (n = 3). G as in (F) but using CD34+ patient-derived AML cells (n = 5). H Western blot of autophagy-related proteins SQSTM1/p62 (62 kDa) and LC3B-II (16 kDa), including loading control beta-actin (42 kDa), upon incubation with Gal-9 (300 nM, 6 h) in the THP-1 cell line and a patient-derived CD34+ AML sample. I Western blot of the whole cell line panel as well as four different patient-derived AML samples detecting LC3B-II (16 kDa) and the loading control beta-actin (42 kDa) upon treatment with Gal-9 (300 nM, 16 h). J Association of the Gal-9 sensitivity (either low EC50/highly sensitive or high EC50/weakly sensitive) with the accumulation of LC3B-II upon treatment with Gal-9, as shown in (I). K As in (J), but comparing sensitivity for Gal-9 with the basal autophagic flux as determined by incubation with CQ (Supplementary Fig. 4B). L Fluorescent images of the K562-LC3.mCherry.GFP model cell line treated with Gal-9 (150 nM, 16 h). The arrow highlights cells with mCherry-GFP double-positive cells. M Representative confocal images of Gal-9 accumulation in the lysosomes of AML cells using fluorescently labeled Gal-9 (Gal-9-594; red) and counter-stained for LAMP-1 (LAMP1-488; green) and dapi (blue). N As in (M), focusing on the lysosomal morphology upon treatment with Gal-9. The arrow highlights swollen lysosomes.

