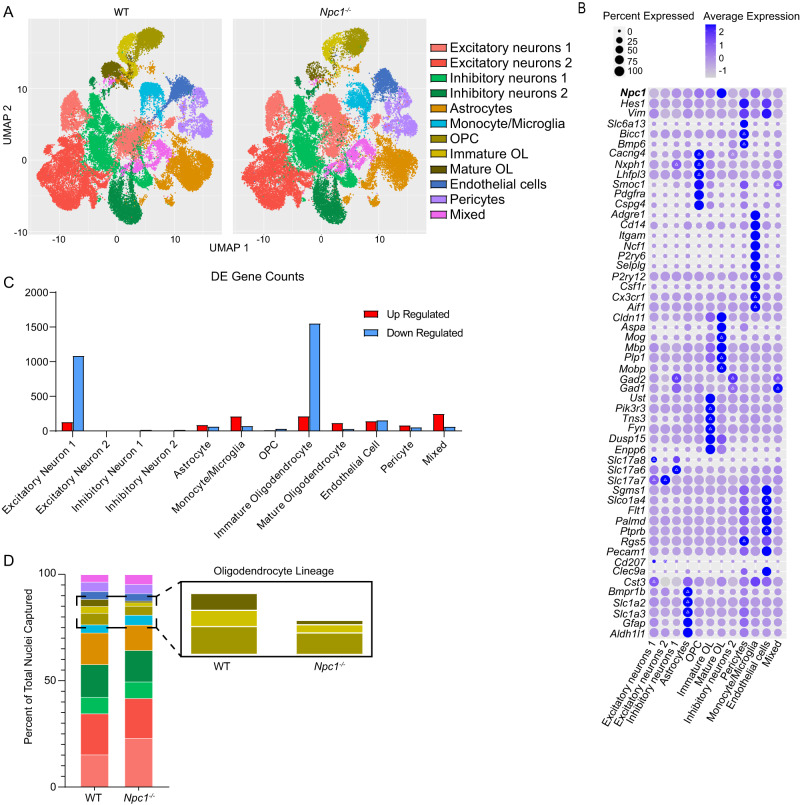
Fig. 1. snRNA-seq of WT and Npc1−/− forebrain at P16.
Nuclei were isolated from the forebrains of three mice per group and sequenced using the 10X Genomics Chromium platform. A UMAP plot for WT and Npc1−/− samples with each point representing a single nucleus. Plot points are clustered into cell type based on gene expression patterns. B Bubble matrix showing the expression of Npc1 (at top) and cluster-defining genes. Delta symbols (Δ) within bubbles indicate the three most highly expressed defining genes for each cluster. Size of the bubble corresponds to the percentage of cells expressing a gene, while bubble color indicates expression level. C Number of up- (red) and down- (blue) regulated differentially expressed (DE) genes (genes with |log2(fold-change)| of > 0.5 and adjusted p < 0.05) per cell cluster as determined through differential expression analysis utilizing a Wilcoxon rank-sum test. Source data are provided as a Source Data file. D Graph showing the percentage of the total nuclei captured in each cluster. The colors and cell types correspond with (A). Inset shows oligodendrocyte lineage.

