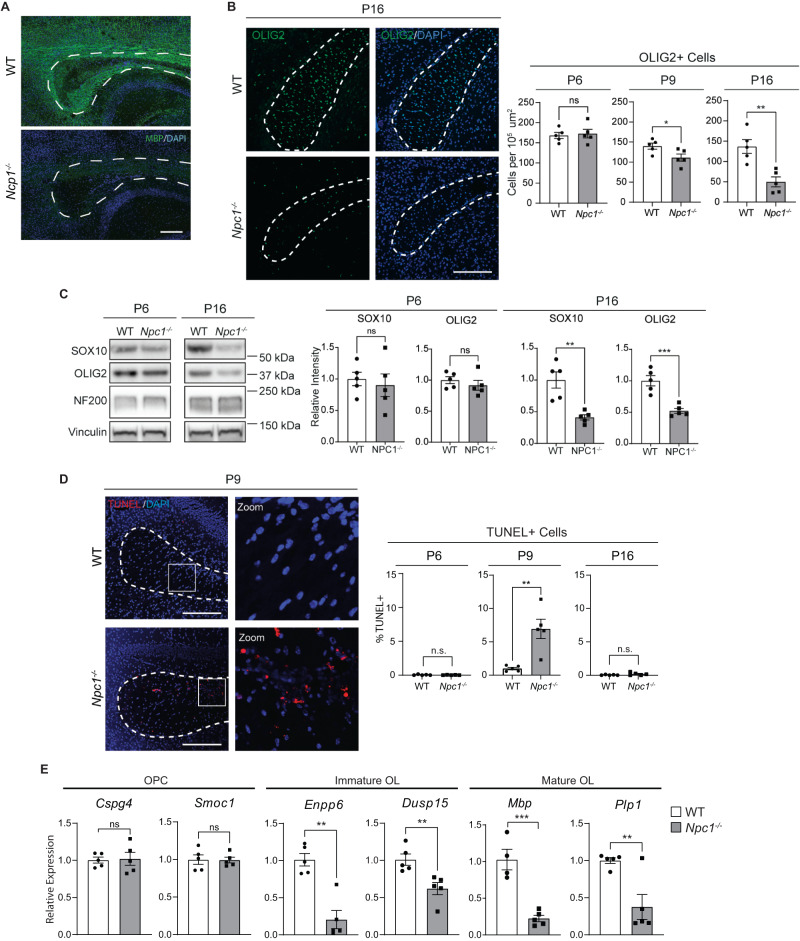
Fig. 2. Death of oligodendrocyte lineage cells during development.
A Midline sagittal brain section from P16 mice stained for MBP (green) and DAPI (blue). B Brain sections from P6, P9, and P16 WT and Npc1−/− mice were stained for oligodendrocyte lineage cells using OLIG2 (green). Nuclei are stained with DAPI (blue). Quantified at right. C Western blot of SOX10, OLIG2, and neurofilament (NF200) from P6 and P16 mouse forebrain. Values were normalized to vinculin and quantified relative to WT. Quantifications at right. D Brain sections were stained for DNA double-strand breaks using a TUNEL assay (red) to detect cell death. Nuclei are stained with DAPI (blue). E Expression of oligodendrocyte stage-specific markers in P16 mouse forebrain as measured by qRT-PCR and normalized to WT. Dashed lines indicate corpus callosum in all images. Scale bars = 200 µm (A) and 150 µm (B and D). Quantified at right. Data are mean ± SEM. n.s. not significant, *p < 0.05,**p < 0.005, ***p < 0.001 by two-tailed unpaired Student’s t-test; (A) Experiment was done on 3 biological replicates per group, all with similar results; (B) n = 5 mice; t = 0.3385, 2.477, 4.182; df = 8; p = 0.7437, 0.0383, 0.0031 (C) n = 5 mice; t = 0.47, 0.90, 4.33, 5.30; df = 8; p = 0.6487, 0.3958, 0.0025, 0.0007; (D) n = 5 mice; t = 0.6961, 4.081, 1.463; df = 8; p = 0.5061, 0.0035, 0.1817; (E) n = 5 mice; t = 0.1813, 0.06927, 3.891, 3.479, 6.470, 3.618; df = 8; p = 0.8606, 0.9465, 0.0046, 0.0083, 0.0002, 0.0068. Source data are provided as a Source Data file.

