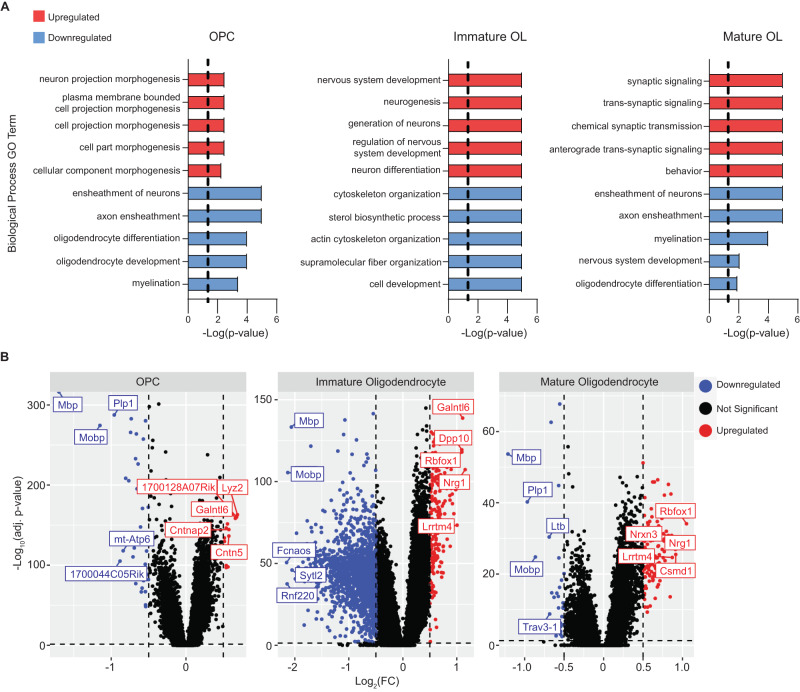
Fig. 3. Gene expression changes in the oligodendrocyte lineage.
A Gene Ontology analysis was performed on differentially expressed genes (DE) identified by snRNA-seq. The 10 most significant (by p-value) up- (red) and down-regulated (blue) GO terms (biological process) in Npc1−/− oligodendrocyte lineage cells are shown. The dashed line indicates an adjusted p < 0.05 after Bonferroni correction. B Volcano plots of DE genes in the oligodendrocyte lineage as determined by differential expression analysis of snRNA-seq. The top 5 up- or down-regulated genes by log2(FC) are labeled. Dashed lines correspond to an adjusted p-value of 0.05 and a |log2(FC)| of 0.5.

