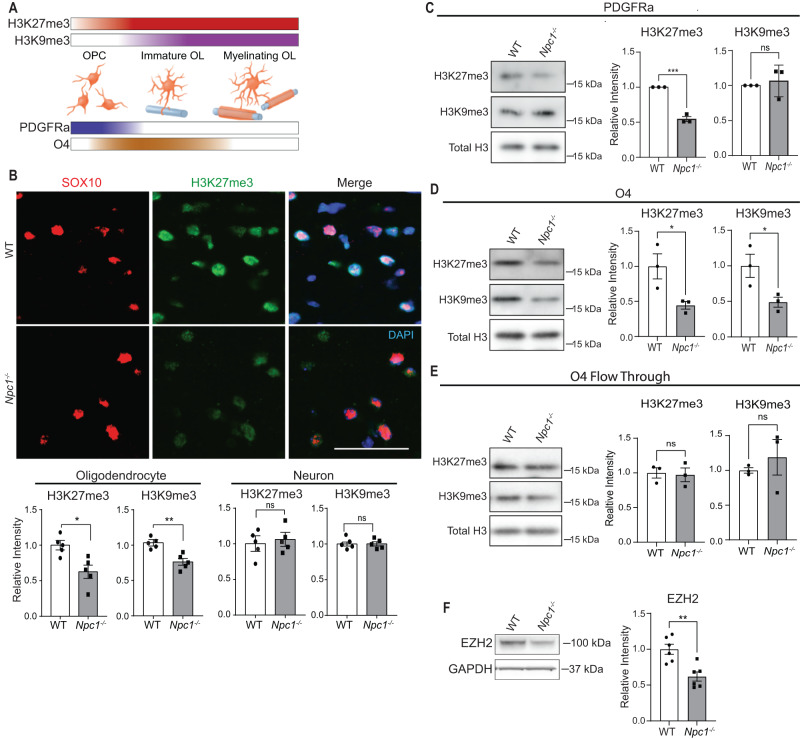
Fig. 4. Epigenetic dysregulation of Npc1−/− oligodendrocytes.
A H3K27me3 and H3K9me3 increase as oligodendrocytes differentiate. PDGFRa expression peaks earlier in development compared to O4. The color in the bars approximates marker levels. B Brain sections from P16 WT and Npc1−/− mice were stained for H3K9me3 or H3K27me3 (green) and co-stained for SOX10 (red, oligodendrocytes) or NeuN (neurons). Nuclei stained with DAPI (blue). Images were captured from the corpus callosum (oligodendrocytes) and cortex (neurons). Representative images show H3K27me3 in OLs; images of NeuN and OL H3K9me3 stains in Supplementary Fig. 4. Scale bar = 50 µm. Methylation staining intensity in the cortex (neurons) and corpus callosum (oligodendrocytes) is quantified below. Methylation intensity was quantified in SOX10+ or NeuN+ cells and values were normalized to WT. Western blot of histones extracted from cells purified from P16 mice using microbeads targeting PDGFRa (C), O4 (D), or the flow through cells left over after cell purification (E). Values were normalized to total H3 and quantified relative to WT. F Western blot of EZH2 from O4-purified cells. Data are mean ± SEM. n.s. not significant, *p < 0.05,**p < 0.005, ***p < 0.001 by two-tailed unpaired Student’s t-test; (B) n = 5 mice; t = 3.1, 4.2, 0.4, 0.3; df = 8; p = 0.0146, 0.0031, 0.6765, 0.8028; (C) n = 3 biological replicates; t = 12.9, 0.5; df = 4; p = 0.0002, 0.6418; (D) n = 3; t = 3.0, 2.9; df = 4; p = 0.0415, 0.0451 (E) n = 3 biological replicates; t = 0.03, 0.7; df = 4; p = 0.9754, 0.5059; (F) n = 6 biological replicates; t = 4.0; df = 10; p = 0.0025. Source data are provided as a Source Data file.

