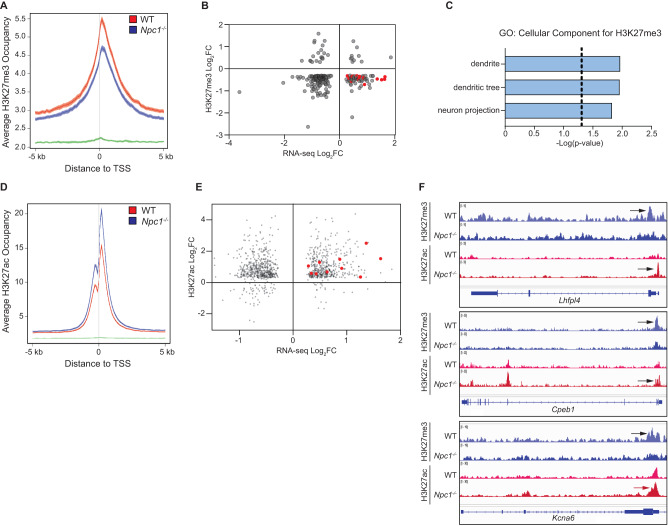
Fig. 5. Dysregulation of H3K27me3 and H3K27ac at neuron-related genes.
ChIP-seq was performed on O4-purified cells from P16 WT and Npc1-/- mice. A Average H3K27me3 occupancy at gene promoters (defined as being within 5 kb of transcription start site (TSS)) for WT (red), Npc1−/− (blue), and background (green). B H3K27me3 promoter enrichment (Npc1−/− relative to WT, log2(fold change), y-axis) plotted against gene expression (Npc1-/- relative to WT, log2(fold change), x-axis) for genes with differential H3K27me3 (defined as having a log2(fold change) <−0.3) and significant changes in expression. Red dots indicate 16 genes associated with neuronal pathways. C Pathways significantly enriched among genes with decreased H3K27me3 and increased expression in Npc1−/− cells, as determined by Gene Ontology: Cellular Component analysis with Bonferroni correction. D Average H3K27ac occupancy at gene promoters for WT (red), Npc1−/− (blue), and background (green). E H3K27ac promoter enrichment (Npc1−/− relative to WT, log2(fold change), y-axis) plotted against gene expression (Npc1−/− relative to WT, log2 fold change, x-axis) for genes with differential H3K27ac and significant changes in expression. Red dots indicate 10 genes associated with neuronal pathways. F IGV genome browser snapshots of H3K27me3 (blue) and H3K27ac (red) bigWig files at promoter regions of Lhfpl4, Cpeb1, and Kcna6. Arrows point to areas of enrichment. A, D Center of plotted lines indicates average occupancy, while line thickness shows the 95% confidence interval.

