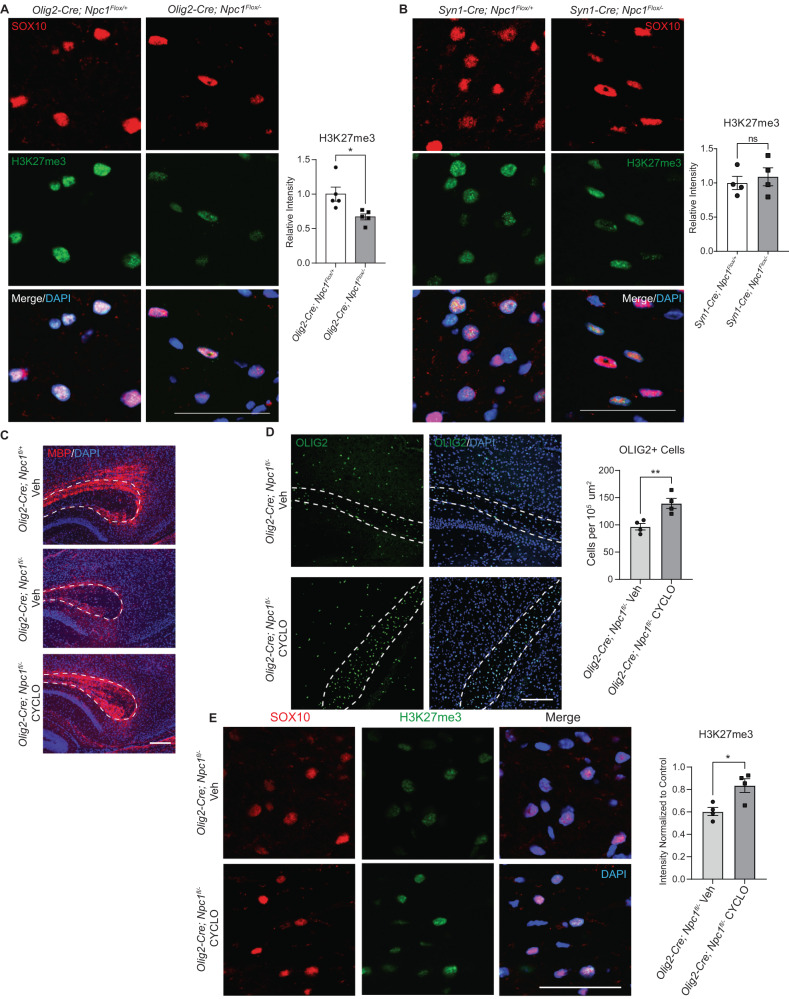
Fig. 8. Cell-autonomous defects in H3K27me3 are corrected by 2-hydroxypropyl-β-cyclodextrin.
H3K27me3 staining (green) was performed on sagittal brain sections from (A) Olig2-Cre;Npc1fl/+ and Olig2-Cre;Npc1fl/− or (B) Syn1-Cre;Npc1fl/+ and Syn-Cre;Npc1fl/− mice at P16. Sections were co-stained for SOX10 (red) and DAPI (blue). Images were taken from the corpus callosum, and H3K27me3 intensity within SOX10 + cells was quantified relative to control. C–E Olig2-Cre;Npc1fl/+ and Olig2-Cre;Npc1fl/− mice were administered 2-hydroxypropyl-β-cyclodextrin (4000 mg/kg, i.p.) (HPβCD) or a vehicle control (saline) (Veh) at P7. Brains were collected at P16. Sagittal sections were stained for (C) MBP (red), (D) OLIG2 (green), and (E) H3K27me3 (green). DAPI is in blue. Dashed lines outline the corpus callosum. The experiment in (C) was done on 3 biological replicates per group, all with similar results. OLIG2+ cells in the corpus callosum were quantified normalized to area (D). H3K27me3 intensity in SOX10+ (red) cells of the corpus callosum were quantified relative to Olig2-Cre;Npc1fl/+ mice treated with vehicle (E). Scale bars = 50 µm (A, B, E), 200 µm (C), and 150 µm (D). Data are mean ± SEM. n.s. not significant, *p < 0.05, **p < 0.005 by two-tailed unpaired Student’s t-test. A n = 5 mice; t = 2.968; df = 8; p = 0.0179; (B) n = 4 mice; t = 0.5540; df = 6; p = 0.5996 (D) n = 4 mice; t = 3.826; df = 6; p = 0.0087; (E) n = 4 mice; t = 3.274; df = 6; p = 0.0170. Source data are provided as a Source Data file.

