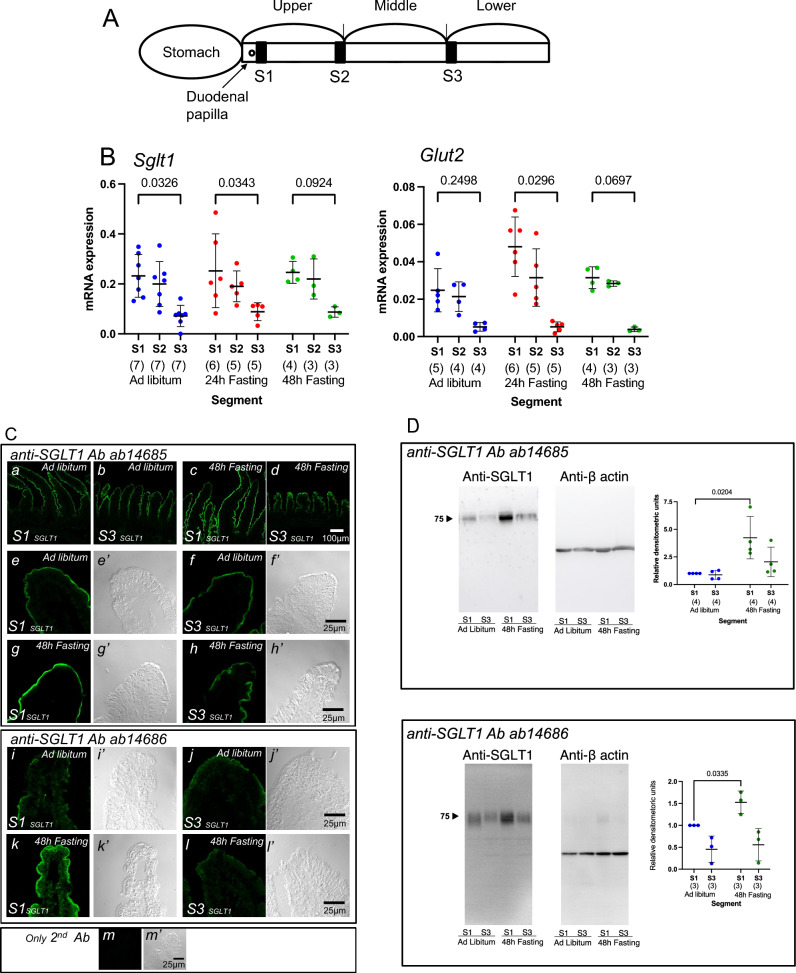
Figure 1.
Effect of fasting on expression of sodium-dependent glucose transporter 1 (SGLT1) and facilitated glucose transporters (GLUT2) along the intestinal axis. Designation of the segments of the small intestine (A). The small intestine was divided into three segments. The distal part of the duodenal papilla is designated as S1 segment, the most distal part of upper segment is designated as S2 segment, and the proximal part of the third part is designated as S3 segment. The mRNA expression levels and effect of fasting on Sglt1 and Glut2 (B). Data are presented as mean ± standard deviation (SD). Two-way ANOVA followed by Tukey’s multiple comparisons test. P values are shown with numbers. Numbers in parentheses indicate the number of animals. To determine the specificity of immunofluorescent staining (C) and Western blotting (D) for SGLT1, two antibodies (ab14685 and ab14686) were used. The upper panel shows images with ab14685 antibody (C). The top row images (a–d) show a low magnification view (20× objective). The middle and bottom two rows (e–h) display higher magnification magnified images (63× objective) with their respective differential interference contrast (DIC) images, indicated by lowercase letters with a prime mark, to demonstrate the specificity of the signal. The middle panel shows images with ab14686 antibody. The top row images (i and j) show in ad libitum mice and bottom row (k and l) shows in 48-h fasted mice. The bottom panel (m) depicts the negative control using only secondary antibodies. Images are representative of three animals. To compare fluorescence levels, the images were taken under the same configurations in each condition. Brush border membranes vesicles (BBMVs) were prepared from intestinal epithelial cells and analyzed by western blotting (D). The image illustrated is representative of four and three similar experiments with ab14685 and ab14686, respectively. The graph shown is a summary of the quantitation of the SGLT1 signals. Numbers in parentheses indicate the number of animals. Relative values are shown with S1 from ad libitum-fed mice as 1. Each lane was loaded with 5 μg of total protein, the membrane stained with β-actin is shown as a loading control.

