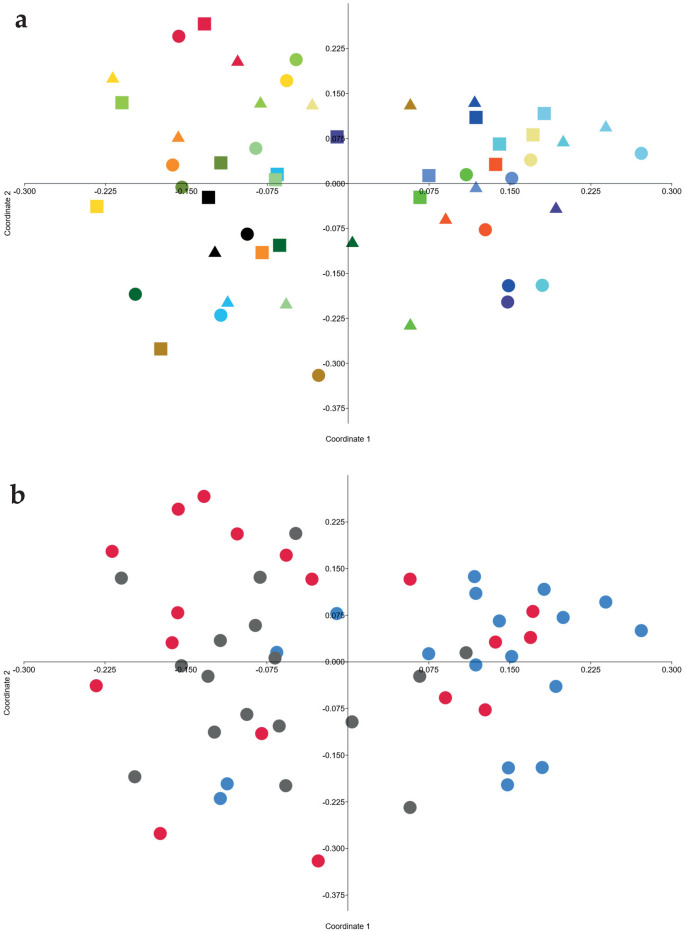
Figure 1.
Principal coordinate analysis plots based on Bray Curtis distance metrics on operational taxonomic unit data. Each point represents one fecal sample from one dog following an experimental diet period. Both plots represent the same data, but colored differently. (A) Different colors represent individual dogs. Square = wheat diet (WHE), triangle = oat diet (OAT), dot = rye diet (RYE). (B) Different colors represent different diet orders. Blue = WHE–OAT-RYE, Red = OAT-RYE-WHE. Grey = RYE-WHE-OAT.

