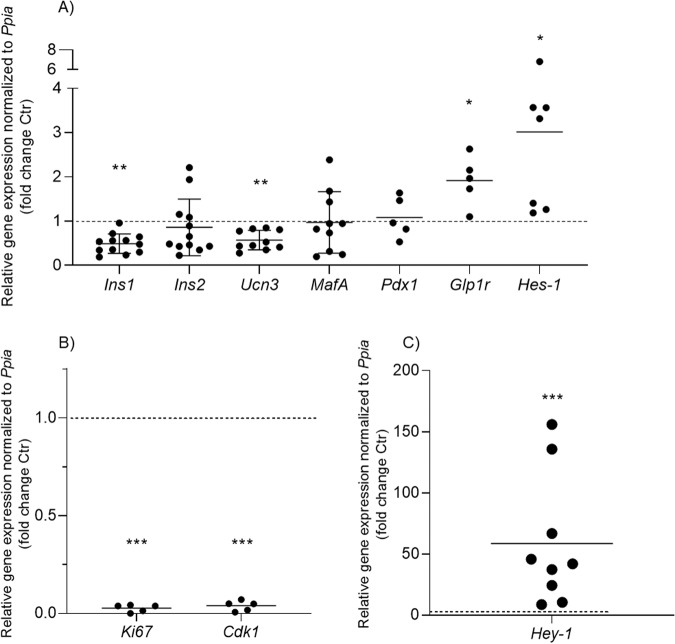
Fig. 2. BMP-2 induced changes of key beta cell gene expression.
Mouse islets were exposed to BMP-2 (50 ng/ml) or left non-exposed for 10 days. Relative mRNA expression of A Ins1, Ins2, Ucn3, MafA, Pdx1, Glp1r, and Hes-1, N = 5–12, B Ki67 and Cdk1, N = 5, and C Hey-1, N = 9 was analyzed using real-time PCR. Expression levels are normalized to control Ppia and Ctr data were set to 1 represented by the dotted horizontal line. Data were shown as means ± SD, *p < 0.05; **p < 0.01, ***p < 0.001 2-sided paired t-test vs. ctr on log10 transformed data.

