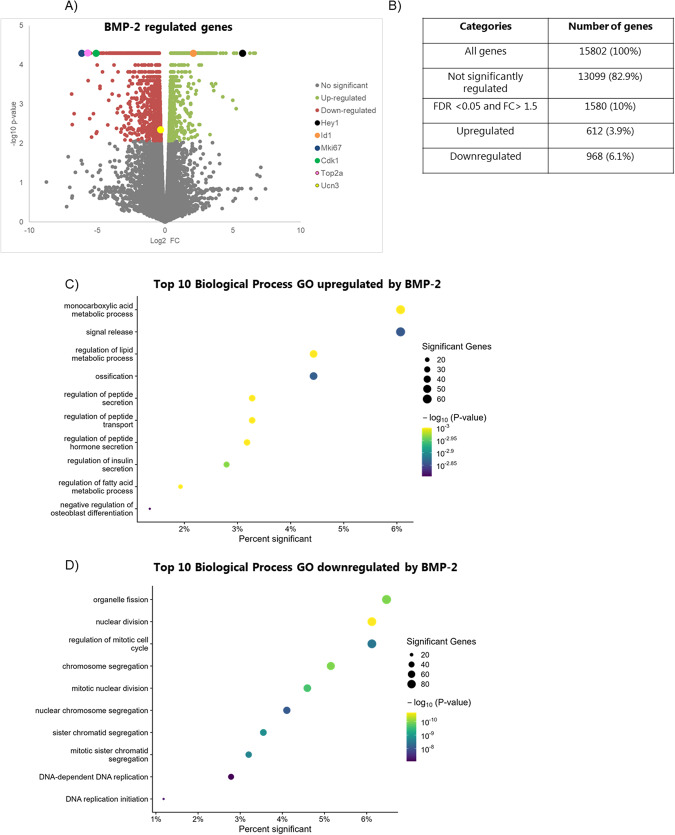
Fig. 3. BMP-2 exposure affects global RNA expression.
Mouse islets were exposed to BMP-2 (50 pg/ml) or left non-exposed for 10 days. A Volcano plot representing the differential expressed RNA’s between BMP-2 vs. ctr exposed mouse islets. X-axis: log2 gene expression fold-change, Y-axis: −log10 p value. Each dot represents an individual RNA. Gray: not significantly regulated genes, green: FDR <0.05 upregulated genes, and red FDR <0.05 downregulated genes. Selected regulated genes by BMP-2 are marked. B Table showing the summary of genes regulated by BMP-2. C, D Top ten most significantly enriched biological processes GO of BMP-2 upregulated and downregulated genes, respectively. X-axis: Percent of genes in the GO significantly regulated by BMP-2. Circle size: Number of significant BMP-2 regulated genes in the GO.

