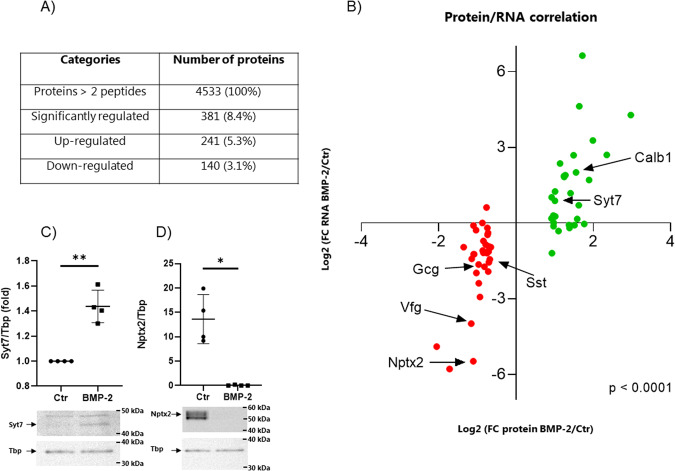
Fig. 4. BMP-2 regulated gene expression correlates with protein expression.
Mouse islets were exposed to BMP-2 (50 pg/ml) or left non-exposed for 10 days. Mass spectrometry was performed on extracts and A show significantly regulated (up or down) proteins (proteins >2 peptides, FDR <0.05, FC >0.3)) in BMP-2 exposed vs. ctr islets, N = 5. B Correlation plot of Protein vs. RNA regulated by BMP-2. X-axis: Log2 (FC protein BMP-2/ctr), y-axis: Log2 (FC RNA BMP-2/ctr). The top 35 significantly up- and down-regulated proteins are shown. Gray dots represent proteins where the corresponding mRNA was not significantly regulated by BMP-2. Green dots represent proteins where the corresponding mRNA was significantly upregulated by BMP-2 and red dots represent proteins where the corresponding mRNA was significantly downregulated by BMP-2. Spearman correlation test ***p < 0.0001. C Nptx2 and D Syt7 protein expression was measured in whole cell extracts from mouse islets exposed as described above using Western blotting. Representative blots are shown, and Tbp was used as a loading control. Band intensities were quantified using Image Studio and data were shown as fold increase relative to Ctr (Syt7) or as relative A.U. expression (Nptx2). Data show means ± SD of N = 4. *p < 0.05, **p < 0.01, two-sided paired t-test vs ctr.

