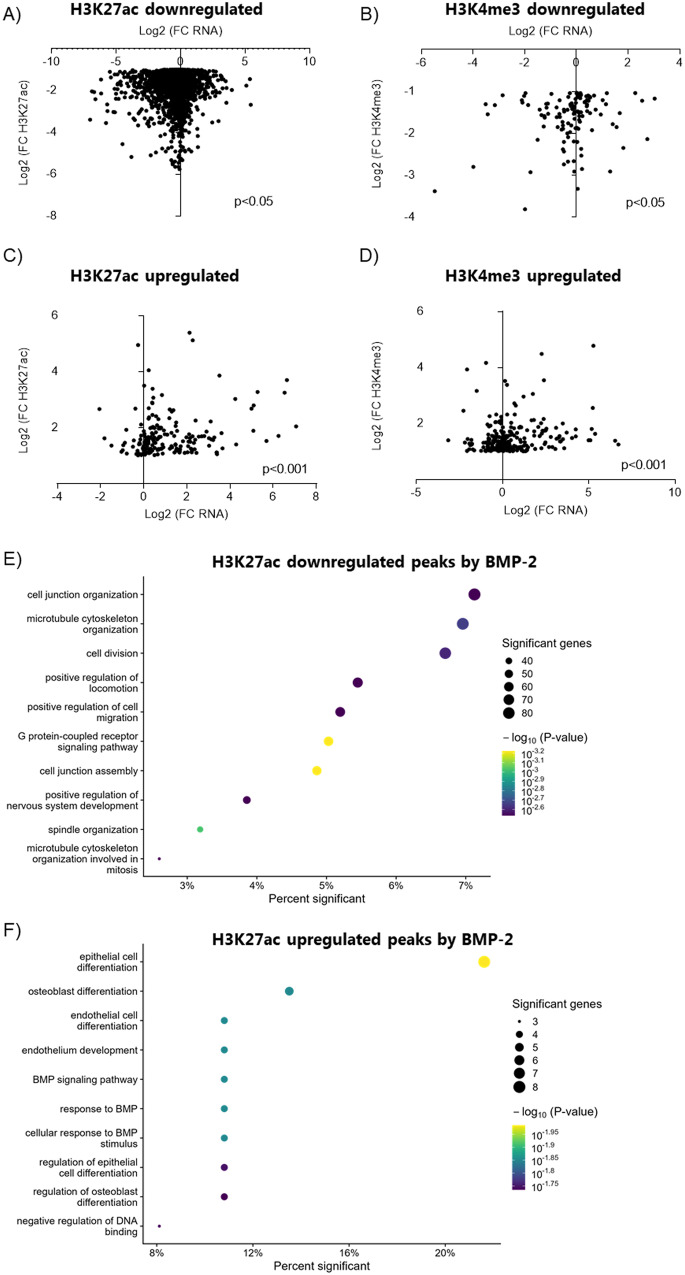
Fig. 6. BMP-2-induced changes in RNA expression are associated with changes in histone modifications.
Graph showing the correlation between RNA fold-change and A H3K27ac Ctr enriched peaks. B H3K4me3 Ctr enriched peaks. C H3K27ac BMP-2 enriched peaks. D H3K4me3 BMP-2 enriched peaks. X-axis: Log2 (FC RNA) Y-axis: Log2 (FC histone modification). *p < 0.05, ***p < 0.001 Spearman correlation test. E Biological process GO analysis on H3K27ac downregulated peaks associated with TSS of genes. F Biological process GO on H3K27ac BMP-2 upregulated peaks associated with TSS of genes. X-axis: Percent of genes in the GO with a differential peak associated with TSS. Circle: Number of genes in the GO with a BMP-2 regulated differential peak associated with their TSS.

