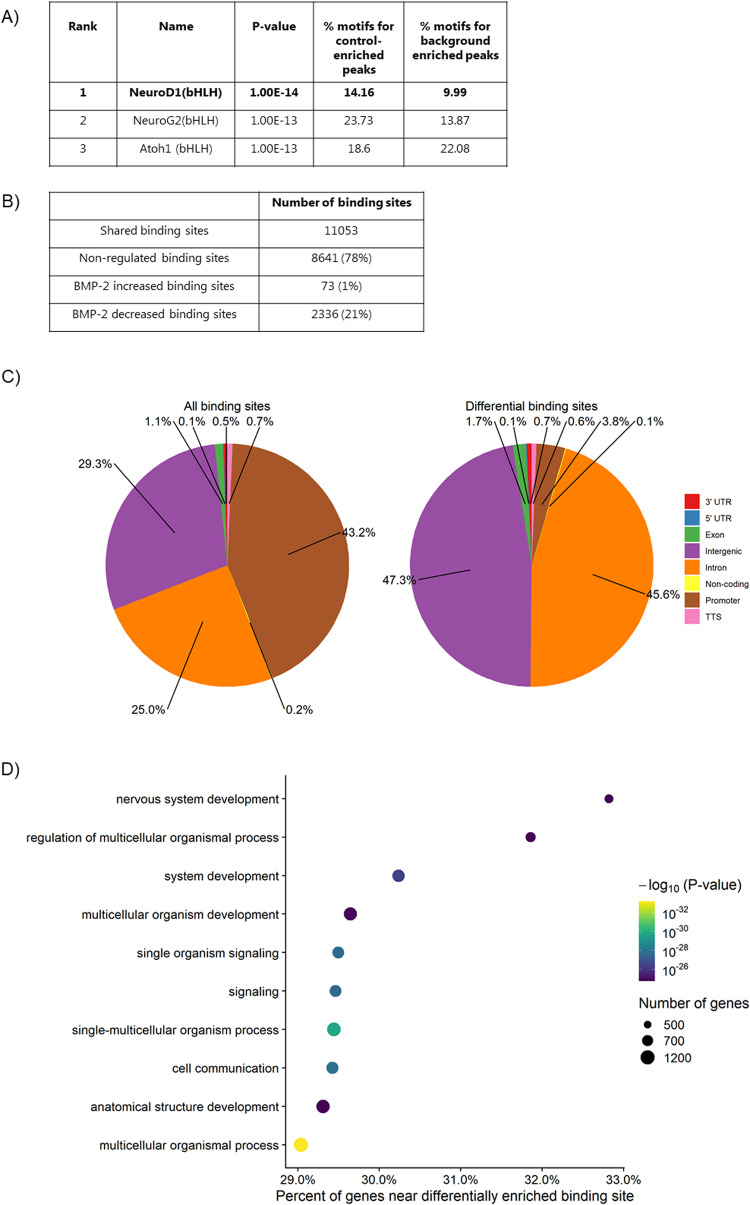
Fig. 7. BMP-2 induced regulation of NeuroD1 chromatin binding.
A Table depicting the top three enriched motifs in H3K27ac Control enriched (downregulated by BMP-2) peaks. B ChIP analysis showing the number of NeuroD1 binding sites (peaks) upregulated and downregulated by BMP-2. C Distribution of NeuroD1 occupied binding sites in the genome and differential NeuroD1 binding sites in response to BMP-2. D Biological processes GO analysis on BMP-2 downregulated NeuroD1 binding sites. X-axis: Percent of all genes in GO, that are near a differentially enriched binding site. Circle: Number of genes in the GO close to a differentially enriched binding site.

