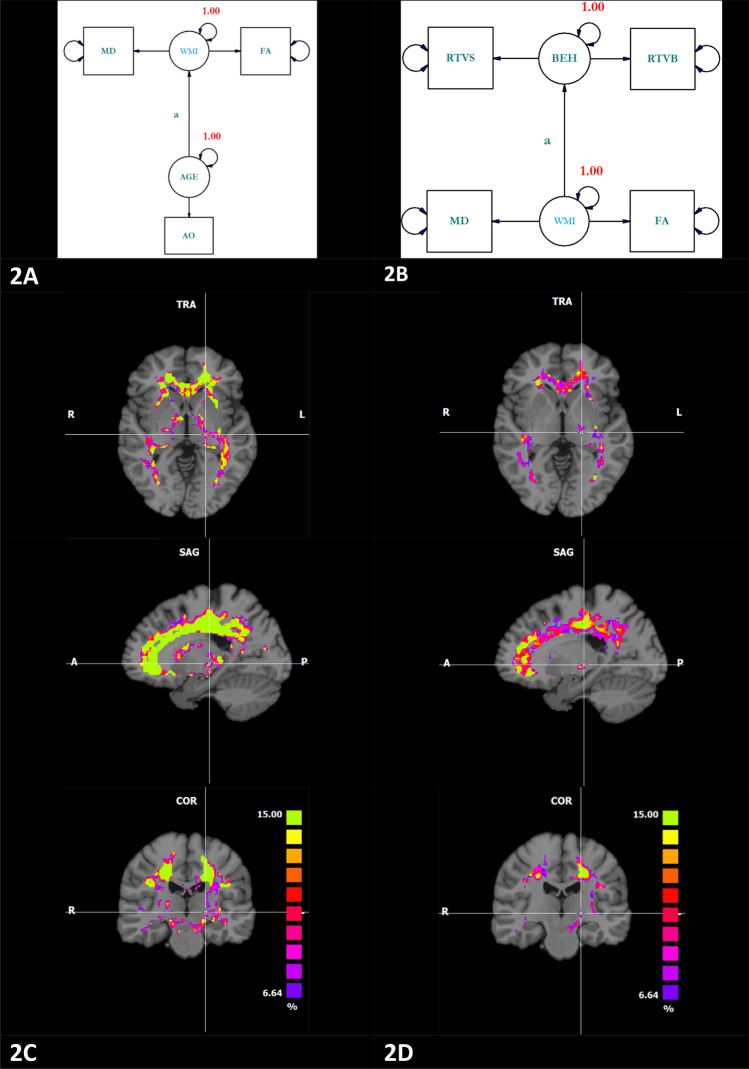
Figure 2.
Structural equation models that conceptualize the relation between age and white matter integrity (A) or the relation between cognition and white matter (B). Note that FA was multiplicated by − 1. The statistical significance of the path “a” as depicted in (A) and (B) was tested and expressed as a chi-square difference statistic. The purple color (Chi-square difference = 6.64) refers to a p-value of 0.01 the green color (Chi-square difference = 15) refers to a p-value of 0.0001.

