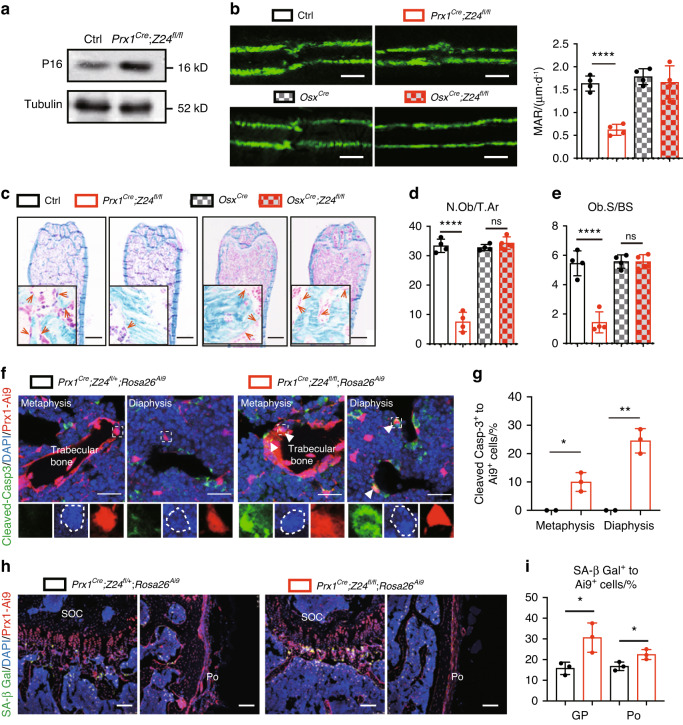
Fig. 2.
Degeneration of cell renewal in Prx1Cre;Z24fl/fl mice leads to bone loss. a Western blotting analysis of the expression of P16 in bone tissues of Prx1Cre;Z24fl/fl mice and their littermate controls. Tubulin was used as a reference protein. b Calcein double staining and mineral appositional rate (MAR) analysis of 16-week-old Prx1Cre;Z24fl/fl, OsxCre;Z24fl/fl and their littermate controls. Scale bars, 20 μm. Data shown are from four replicates. c Masson staining of femur hard slides. Scale bars, 80 mm. Quantification of the number of osteoblasts per tissue area (N.Ob/T.Ar) (d) and osteoblast surface per bone surface (Ob. BS) (e). f Immunofluorescence images of cleaved Caspase-3 in the metaphysis and diaphysis. Scale bars, 25 μm. g Proportion of cleaved Caspase-3+ cells to Prx1Cre; Rosa26Ai9 cells in tissue sections. h Immunofluorescence images of SA-β Gal in the growth plate. SOC secondary ossification center, Po periosteum. Scale bars, 100 μm. i Proportion of SA-β Gal+ cells to Prx1Cre; Rosa26Ai9 cells in tissue sections. The statistical significance of differences was assessed using two-tailed Student’s paired t test (*P < 0.05, **P < 0.01, ***P < 0.001 and ****P < 0.000 1)

