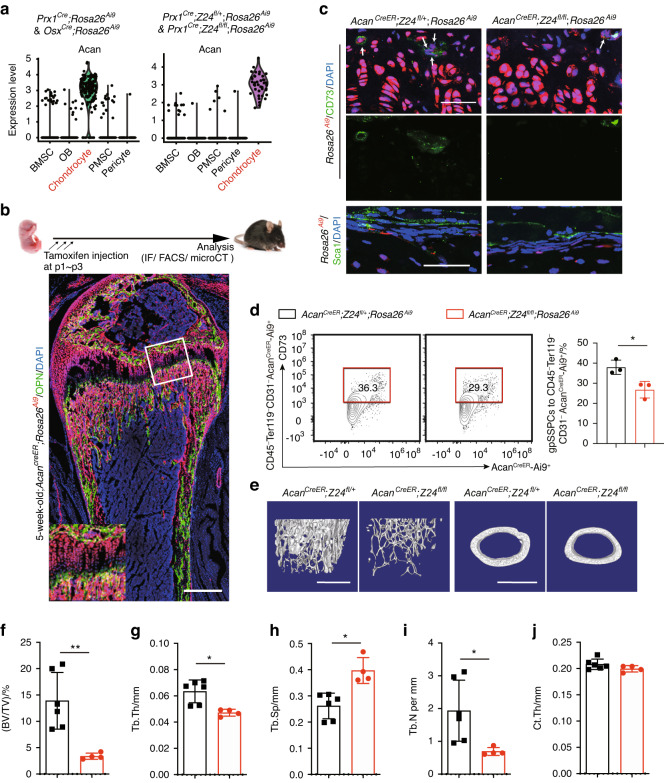
Fig. 5.
AcanCreER;Z24fl/fl mice exhibit trabecular bone loss. a Violin plots showing the expression levels and distribution of Acan. b Fluorescence images of OPN in femur sections from AcanCreER; Rosa26Ai9 mice that were injected with tamoxifen at p1-p3. Mice were analyzed after 5 weeks. Scale bar, 0.5 mm. c Fluorescence images of CD73 in the growth plate and Sca1 in the periosteum of 16-week-old AcanCreER; Z24fl/fl; Rosa26Ai9 mice and AcanCreER; Z24fl/+; Rosa26Ai9 mice. Scale bars, 50 μm. d FACS analysis of the distribution of Acan+CD73+ cells from growth plates of 8-week-old AcanCreER; Z24fl/+; Rosa26Ai9 and AcanCreER; Z24fl/fl; Rosa26Ai9 mice that were injected with tamoxifen at p1-p3. n = 3 per group. Data are presented as the mean ± SD. e MicroCT images showing femurs of 16-week-old AcanCreER; Z24fl/fl mice and their littermate controls. Scale bars, 1 mm. Quantitative analyses of trabecular bone volume/total volume (BV/TV) (f), trabecular thickness (Tb.Th) (g), trabecular spacing (Tb.Sp) (h), trabecular number (Tb.N) (i) and cortical thickness (Ct.Th) (j) in the femur metaphysis of 16-week-old AcanCreER; Z24fl/fl mice (n = 4) and their littermate controls (n = 6). The statistical significance of differences was assessed using two-tailed Student’s paired t test (*P < 0.05, **P < 0.01, ***P < 0.001 and ****P < 0.000 1)

