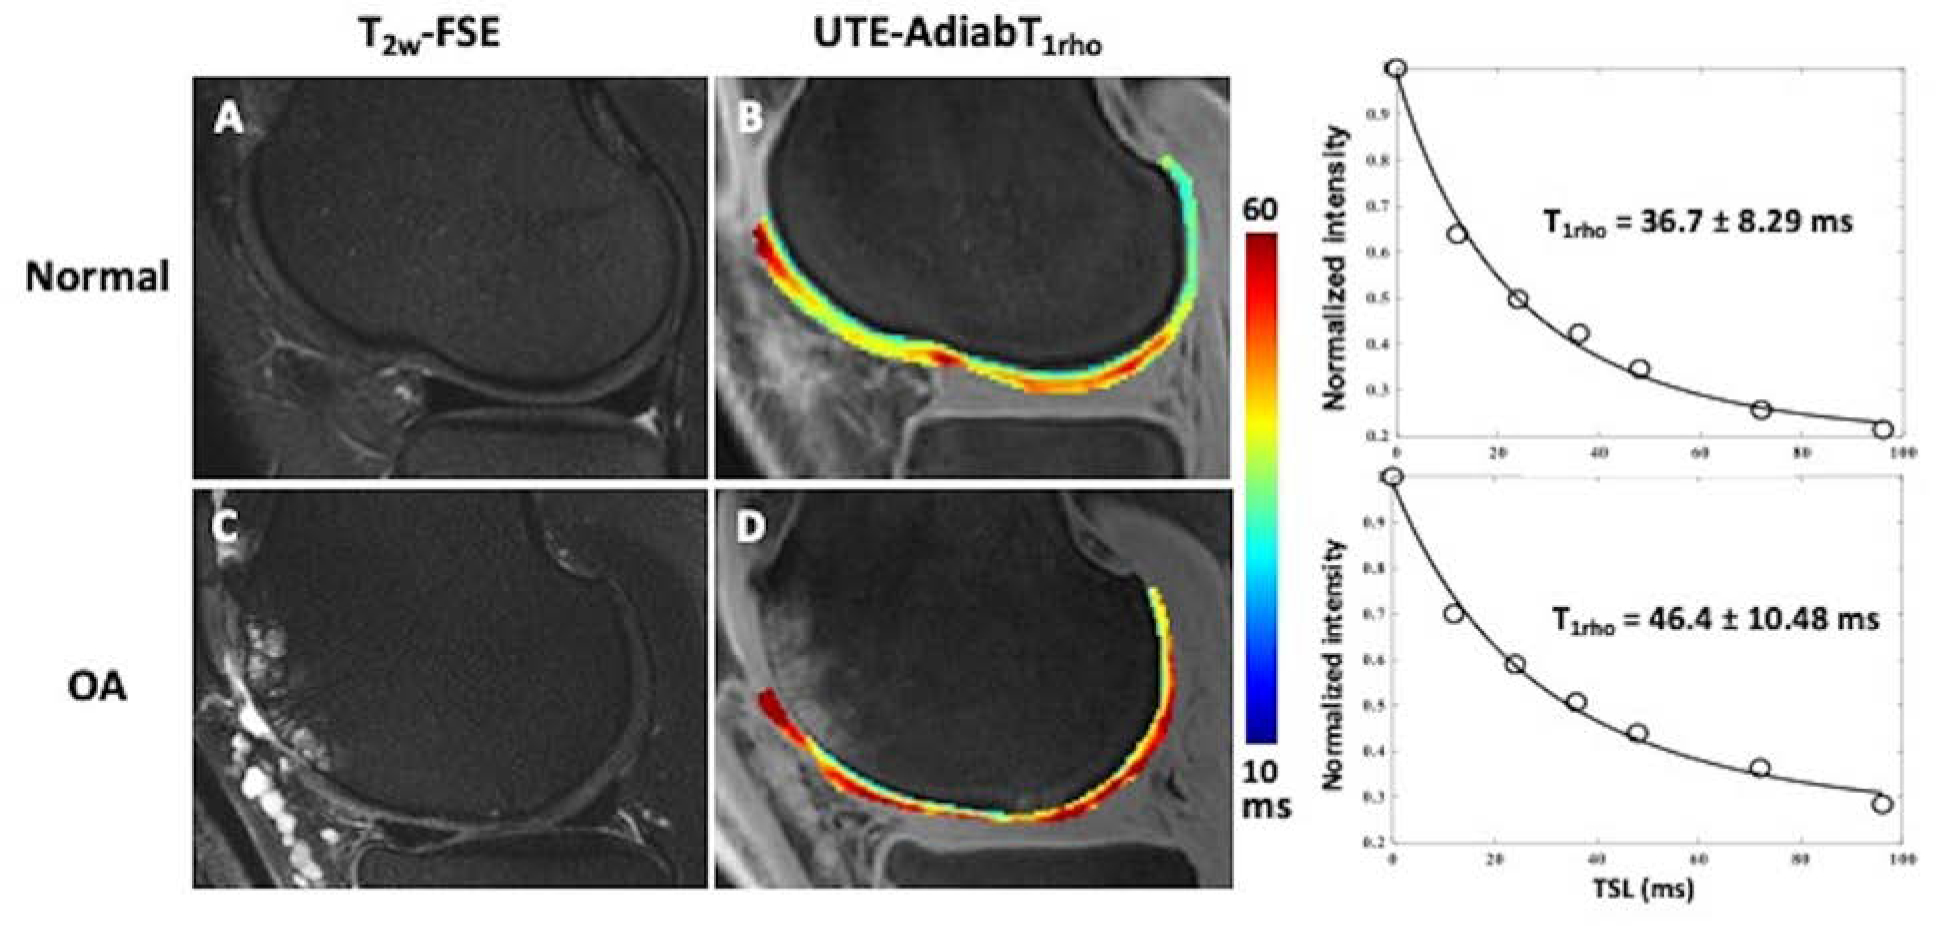
Figure 2.

In vivo 3D UTE-AdiabT1rho mapping of articular cartilage in normal (A-C) and osteoarthritic (D-F) knees. T2w-FSE images demonstrates normal appearance of the cartilage in the normal knee (A) and diffuse chondral thinning with areas of high-grade chondral loss and subchondral cystic change in the osteoarthritic knee (D).The corresponding color maps (B, E) and UTE-AdibT1rho fitting curves (C, F) demonstrate elevated UTE-AdiabT1rho values in osteoarthritis (E, F) compared to the normal knee (B,C). Color map in both normal (B) and osteoarthritic (D) knees distinguish the calcified cartilage from superficial. Further the normal (B) color map demonstrates the zonal variation in T1 rho in the superficial cartilage.
