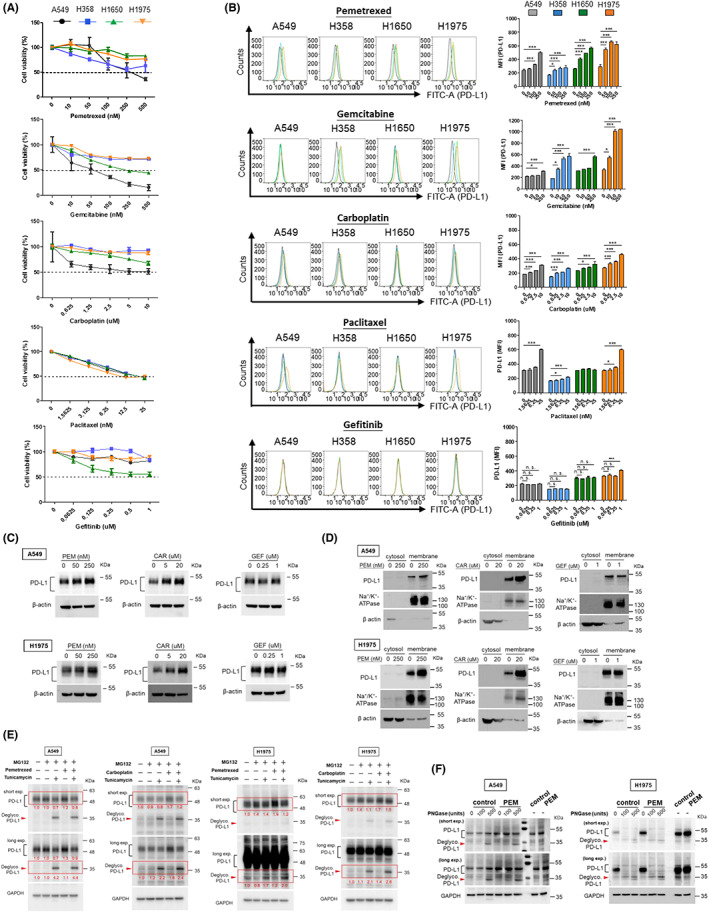
FIGURE 2.

Induction and modulation of PD‐L1 by chemotherapeutics in NSCLC cell lines. (A) NSCLC cells were treated with chemotherapeutics (pemetrexed, gemcitabine, carboplatin, paclitaxel and gefitinib, respectively) at indicated series of increasing concentrations in complete RPMI medium. After 48 h, cell viability was measured using CCK8 assay and absorbance was determined using a cytometer. (B) NSCLC cells were treated with chemotherapeutics as indicated. After 48 h, the cell membrane PD‐L1 expression was analyzed using flow cytometry. The mean fluorescence intensity (MFI) was displayed to identify the expression of membrane PD‐L1. Quantitative results were statistically analyzed from three independent replicates and the significant differences were expressed as *p < 0.05, **p < 0.01 and ***p < 0.001. A549 and H1975 cells were subjected to chemotherapeutics at indicated concentrations for 48 h (CAR, carboplatin; GEF, gefitinib; PEM, pemetrexed). PD‐L1 protein level in (C) total cell lysate, (D) cytosol and membrane fractionations was determined using western blot. Na+/K+ ATPase served as an internal control for the membrane fraction and β‐actin for the cytosolic fraction. (E) A549 and H1975 cells were treated with pemetrexed (250 nM for A549 and 50 nM for H1975) and carboplatin (40 μM), respectively, for 48 h. During treatment, 5 μg/mL tunicamycin and 10 μM MG132 were added into the medium for 24 h and 6 h, respectively, before protein extraction. Glycosylated and de‐glycosylated PD‐L1 were detected by WB analysis. (F) A549 and H1975 cells were treated with pemetrexed (PEM) for 48 h prior to protein extraction. Cell lysates were then incubated with PNGase F to digest the glycosylated proteins and followed by WB analysis to assess the glycosylation/de‐glycosylation pattern of PD‐L1 in cells. Red arrowheads indicate de‐glycosylated PD‐L1.
