FIGURE 3.

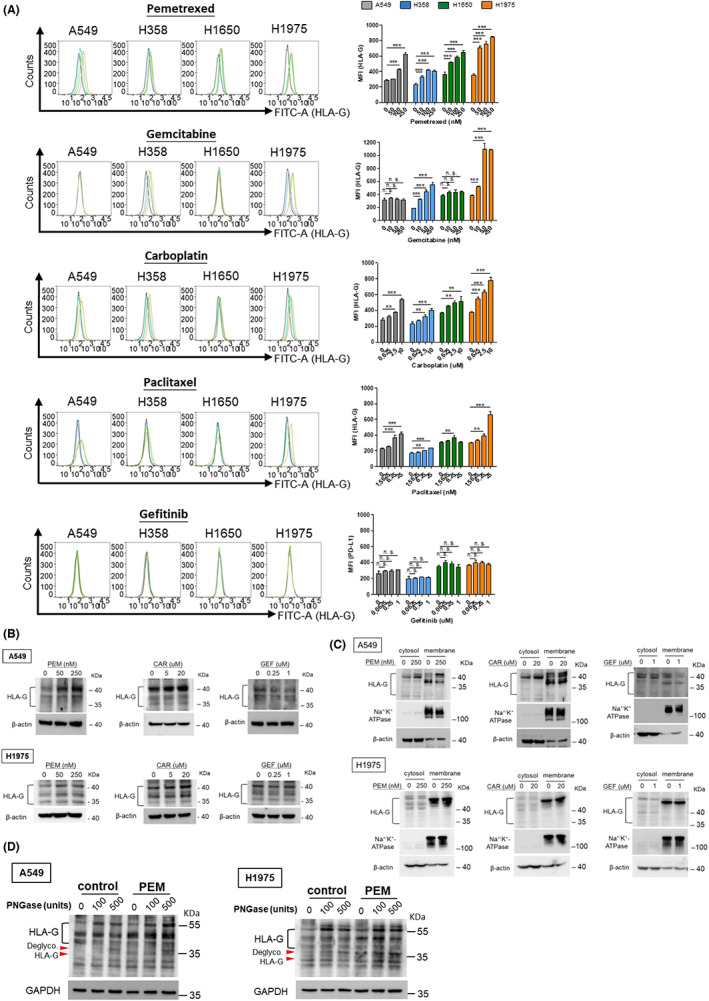
HLA‐G induction by chemotherapeutics in NSCLC cell lines (A) NSCLC cells were treated with chemotherapeutics at indicated concentrations for 48 h. After that, membrane HLA‐G was analyzed by flow cytometry and the MFI was displayed to identify the expression of membrane HLA‐G (right part of panel A). The quantitative results were statistically analyzed from three independent replicates and the significant differences were expressed as *p < 0.05, **p < 0.01 and ***p < 0.001. NSCLC cells were subjected to pemetrexed (PEM), carboplatin (CAR) or gefitinib (GEF) treatment for 48 h, HLA‐G protein levels in total lysate (B) and cytosol/membrane fractionations (C) were determined using western blot (WB) analysis. (D) A549 and H1975 cells were treated with pemetrexed (PEM; 250 nM and 50 nM, respectively) for 48 h followed by protein extraction. Cell lysates were then incubated with PNGase F to digest the glycosylated proteins followed by WB analysis to assess the glycosylation/de‐glycosylation pattern of HLA‐G. Red arrowheads indicate de‐glycosylated HLA‐G.
