
FIGURE 1.
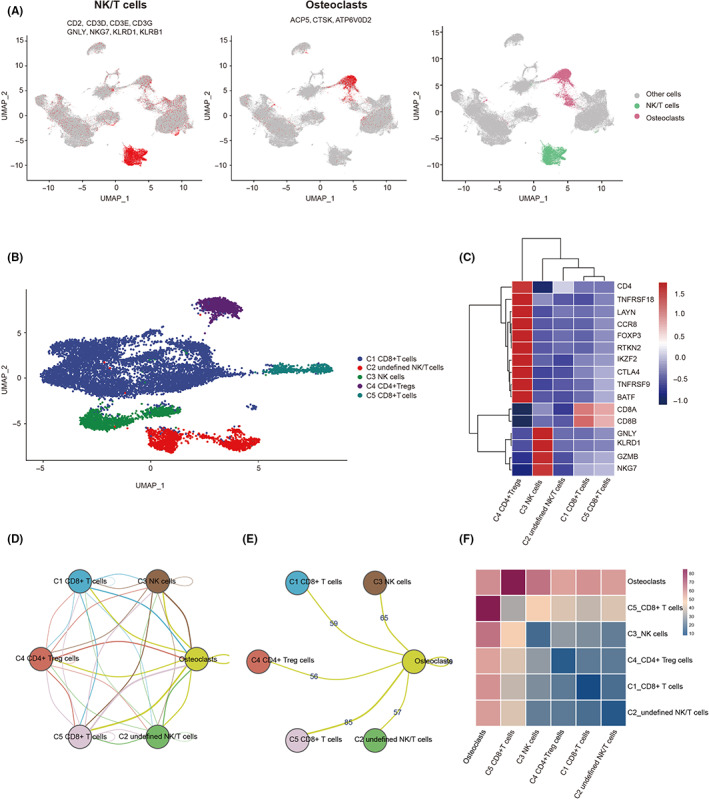
Cell–cell communication analysis of osteoclasts (OCs) and regulatory CD4+ T cells (CD4+ Tregs). (A) UMAP showing the identification and marker genes of natural killer (NK)/T cells and OCs. Different colors indicate different cells. (B) UMAP showing the NK/T cell subtype. Different colors indicate different cells. (C) Heatmap showing the expression of marker genes in NK/T cell subtypes. The higher the expression, the redder the color. (D) Intercellular communication between OCs and NK/T cell subtypes. The more frequent the cross‐talk between the two cells, the more line segments there are between them. (E) Intercellular communication and number of interaction gene sets between OCs and T cell isoforms. (F) Heatmap showing intercellular communication between OCs and T cell subtypes; the more frequent the cross‐talk between two cells, the redder the color.